


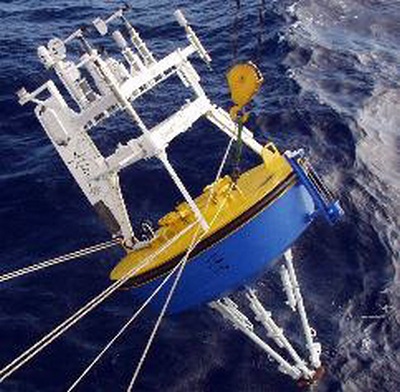
Station 32ST0 - Stratus 
Owned and maintained by Woods Hole Oceanographic Institution
Ocean Reference Station
WAMDAS payload
22.000 S 85.000 W (22°0'0" S 85°0'0" W)
Site elevation: sea level
Air temp height: 2.45 m above site elevation
Anemometer height: 2.71 m above site elevation
Barometer elevation: 2.44 m above mean sea level
Sea temp depth: 1 m below MLLW
Water depth: 4276 m
(24 hours for tsunami stations)
|
Click on the graph icon in the table below to see a time series plot of the last five days of that observation. | |
| ESE ( 110 deg true ) | |
| 13.6 kts | |
| 30.06 in | |
| 67.1 °F | |
| 69.6 °F | |
| 35.30 psu | |
| 59.9 °F | |
| 15.5 kts | |
| 17.5 kts | |
| TIME (CDT) |
WDIR |
WSPD kts |
GST kts |
WVHT ft |
DPD sec |
APD sec |
MWD |
PRES in |
PTDY in |
ATMP °F |
WTMP °F |
DEWP °F |
SAL psu |
VIS nmi |
TIDE ft |
|---|---|---|---|---|---|---|---|---|---|---|---|---|---|---|---|
| 2024-05-08 11:30 pm | ESE | 13.6 | - | - | - | - | - | 30.07 | - | 66.9 | 69.6 | 60.1 | 35.30 | - | - |
| 2024-05-08 10:30 pm | E | 13.6 | - | - | - | - | - | 30.07 | - | 66.9 | 69.6 | 59.5 | 35.30 | - | - |
| 2024-05-08 09:30 pm | ESE | 15.5 | - | - | - | - | - | 30.07 | - | 66.6 | 69.6 | 60.4 | 35.30 | - | - |
| 2024-05-08 08:30 pm | ESE | 15.5 | - | - | - | - | - | 30.06 | - | 66.9 | 69.6 | 60.6 | 35.30 | - | - |
| 2024-05-08 07:30 pm | ESE | 11.7 | - | - | - | - | - | 30.05 | - | 66.9 | 69.8 | 58.1 | 35.30 | - | - |
| 2024-05-08 06:30 pm | SE | 11.7 | - | - | - | - | - | 30.04 | - | 66.6 | 69.8 | 59.4 | 35.30 | - | - |
| 2024-05-08 05:30 pm | SSE | 11.7 | - | - | - | - | - | 30.04 | - | 66.2 | 69.8 | 58.8 | 35.30 | - | - |
| 2024-05-08 04:30 pm | SE | 13.6 | - | - | - | - | - | 30.03 | - | 66.9 | 69.8 | 59.5 | 35.30 | - | - |
| 2024-05-08 03:30 pm | ESE | 11.7 | - | - | - | - | - | 30.04 | - | 67.6 | 70.0 | 60.3 | 35.30 | - | - |
| 2024-05-08 02:30 pm | ESE | 9.7 | - | - | - | - | - | 30.06 | - | 68.2 | 70.0 | 59.0 | 35.30 | - | - |
| 2024-05-08 01:30 pm | ESE | 7.8 | - | - | - | - | - | 30.08 | - | 68.7 | 70.0 | 58.3 | 35.30 | - | - |
| 2024-05-08 12:30 pm | ESE | 5.8 | - | - | - | - | - | 30.09 | - | 68.9 | 69.8 | 58.1 | 35.30 | - | - |
| 2024-05-08 11:30 am | E | 7.8 | - | - | - | - | - | 30.11 | - | 68.7 | 69.8 | 58.5 | 35.30 | - | - |
| 2024-05-08 10:30 am | E | 7.8 | - | - | - | - | - | 30.11 | - | 68.7 | 69.8 | 58.1 | 35.30 | - | - |
| 2024-05-08 09:30 am | E | 5.8 | - | - | - | - | - | 30.10 | - | 67.8 | 69.6 | 57.0 | 35.30 | - | - |
| 2024-05-08 08:30 am | ENE | 1.9 | - | - | - | - | - | 30.10 | - | 66.4 | 69.6 | 57.0 | 35.30 | - | - |
| 2024-05-08 07:30 am | ENE | 9.7 | - | - | - | - | - | 30.09 | - | 65.5 | 69.6 | 57.0 | 35.30 | - | - |
| 2024-05-08 06:30 am | E | 13.6 | - | - | - | - | - | 30.07 | - | 65.7 | 69.6 | 56.7 | 35.30 | - | - |
| 2024-05-08 05:30 am | ESE | 9.7 | - | - | - | - | - | 30.06 | - | 67.5 | 69.6 | 56.8 | 35.30 | - | - |
| 2024-05-08 04:30 am | ESE | 11.7 | - | - | - | - | - | 30.06 | - | 67.6 | 69.6 | 56.1 | 35.30 | - | - |
| 2024-05-08 03:30 am | ESE | 11.7 | - | - | - | - | - | 30.08 | - | 67.8 | 69.6 | 56.5 | 35.30 | - | - |
| 2024-05-08 02:30 am | ESE | 11.7 | - | - | - | - | - | 30.10 | - | 67.8 | 69.6 | 55.6 | 35.30 | - | - |
| 2024-05-08 01:30 am | ESE | 13.6 | - | - | - | - | - | 30.12 | - | 68.2 | 69.6 | 55.6 | 35.30 | - | - |
|
These oceanographic data are displayed in rounded times. Click on the graph icon in the table below to see a time series plot of the last five days of that observation. | |
| Depth (DEPTH): | 3.3 ft |
| 69.62 °F | |
| 35.30 psu | |
| TIME (CDT) |
DEPTH ft |
OTMP °F |
COND mS/cm |
SAL psu |
O2% % |
O2PPM ppm |
CLCON ug/l |
TURB FTU |
PH |
EH mv |
|---|---|---|---|---|---|---|---|---|---|---|
| 2024-05-08 11:30 pm | 3.3 | 69.62 | - | 35.30 | - | - | - | - | - | - |
| 2024-05-08 10:30 pm | 3.3 | 69.62 | - | 35.30 | - | - | - | - | - | - |
| 2024-05-08 09:30 pm | 3.3 | 69.62 | - | 35.30 | - | - | - | - | - | - |
| 2024-05-08 08:30 pm | 3.3 | 69.62 | - | 35.30 | - | - | - | - | - | - |
| 2024-05-08 07:30 pm | 3.3 | 69.80 | - | 35.30 | - | - | - | - | - | - |
| 2024-05-08 06:30 pm | 3.3 | 69.80 | - | 35.30 | - | - | - | - | - | - |
| 2024-05-08 05:30 pm | 3.3 | 69.80 | - | 35.30 | - | - | - | - | - | - |
| 2024-05-08 04:30 pm | 3.3 | 69.80 | - | 35.30 | - | - | - | - | - | - |
| 2024-05-08 03:30 pm | 3.3 | 69.98 | - | 35.30 | - | - | - | - | - | - |
| 2024-05-08 02:30 pm | 3.3 | 69.98 | - | 35.30 | - | - | - | - | - | - |
| 2024-05-08 01:30 pm | 3.3 | 69.98 | - | 35.30 | - | - | - | - | - | - |
| 2024-05-08 12:30 pm | 3.3 | 69.80 | - | 35.30 | - | - | - | - | - | - |
| 2024-05-08 11:30 am | 3.3 | 69.80 | - | 35.30 | - | - | - | - | - | - |
| 2024-05-08 10:30 am | 3.3 | 69.80 | - | 35.30 | - | - | - | - | - | - |
| 2024-05-08 09:30 am | 3.3 | 69.62 | - | 35.30 | - | - | - | - | - | - |
| 2024-05-08 08:30 am | 3.3 | 69.62 | - | 35.30 | - | - | - | - | - | - |
| 2024-05-08 07:30 am | 3.3 | 69.62 | - | 35.30 | - | - | - | - | - | - |
| 2024-05-08 06:30 am | 3.3 | 69.62 | - | 35.30 | - | - | - | - | - | - |
| 2024-05-08 05:30 am | 3.3 | 69.62 | - | 35.30 | - | - | - | - | - | - |
| 2024-05-08 04:30 am | 3.3 | 69.62 | - | 35.30 | - | - | - | - | - | - |
| 2024-05-08 03:30 am | 3.3 | 69.62 | - | 35.30 | - | - | - | - | - | - |
| 2024-05-08 02:30 am | 3.3 | 69.62 | - | 35.30 | - | - | - | - | - | - |
| 2024-05-08 01:30 am | 3.3 | 69.62 | - | 35.30 | - | - | - | - | - | - |
|
Click on the graph icon in the table below to see a time series plot of the last five days of that observation. | ||
| 5.3 | watts/meter2 | |
| 358.7 | watts/meter2 | |
| TIME (CDT) |
SRAD1 w/m2 |
SRAD2 w/m2 |
LRAD w/m2 |
|---|---|---|---|
| 2024-05-08 11:30 pm | - | 5.0 | 347.3 |
| 2024-05-08 10:30 pm | - | 2.4 | 367.8 |
| 2024-05-08 09:30 pm | - | 5.2 | 384.3 |
| 2024-05-08 08:30 pm | - | 5.1 | 386.3 |
| 2024-05-08 07:30 pm | - | 2.7 | 383.2 |
| 2024-05-08 06:30 pm | - | 8.6 | 351.1 |
| 2024-05-08 05:30 pm | - | 69.3 | 380.0 |
| 2024-05-08 04:30 pm | - | 181.5 | 391.3 |
| 2024-05-08 03:30 pm | - | 355.3 | 377.9 |
| 2024-05-08 02:30 pm | - | 378.7 | 381.8 |
| 2024-05-08 01:30 pm | - | 467.8 | 374.9 |
| 2024-05-08 12:30 pm | - | 552.3 | 388.4 |
| 2024-05-08 11:30 am | - | 528.0 | 374.8 |
| 2024-05-08 10:30 am | - | 456.6 | 344.1 |
| 2024-05-08 09:30 am | - | 303.9 | 339.4 |
| 2024-05-08 08:30 am | - | 104.7 | 384.6 |
| 2024-05-08 07:30 am | - | 23.8 | 390.3 |
| 2024-05-08 06:30 am | - | 1.7 | 387.2 |
| 2024-05-08 05:30 am | - | 5.0 | 342.8 |
| 2024-05-08 04:30 am | - | 4.8 | 323.2 |
| 2024-05-08 03:30 am | - | 4.8 | 324.5 |
| 2024-05-08 02:30 am | - | 2.2 | 323.7 |
| 2024-05-08 01:30 am | - | 4.8 | 321.6 |
Links which are specific to this station are listed below:
Real Time Data in tabular form for the last forty-five days.
Historical Data & Climatic Summaries for quality controlled data for prior months and years.