


NDBC has recently revised the NDBC Handbook of Automated Data Quality Control Checks and Procedures. The new document can be found on our Publications page.
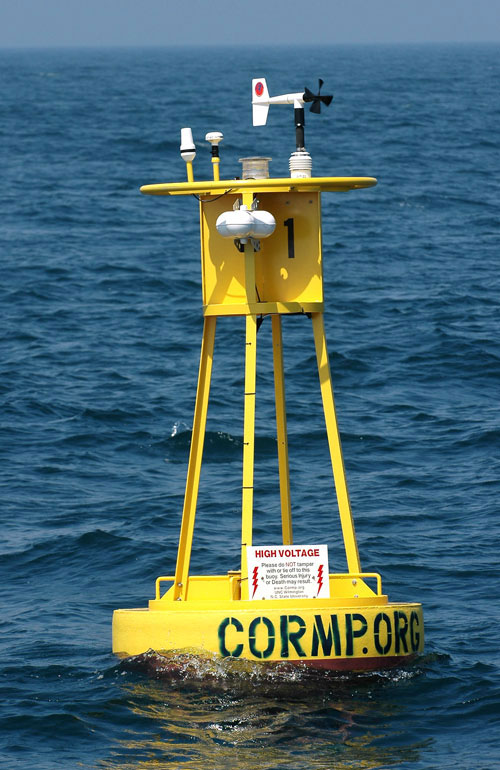
Station 41037 - Wrightsville Beach Offshore, NC (ILM3) 
Owned and maintained by Coastal Ocean Research and Monitoring Program (CORMP)
Moored Buoy
33.988 N 77.362 W (33°59'16" N 77°21'42" W)
Site elevation: sea level
Air temp height: 2.79 m above site elevation
Anemometer height: 2.95 m above site elevation
Barometer elevation: 2.79 m above mean sea level
Sea temp depth: 1 m below water line
Water depth: 30 m
Latest NWS Marine Forecast 1 and Latest NWS Marine Forecast 2
(24 hours for tsunami stations)
|
Click on the graph icon in the table below to see a time series plot of the last five days of that observation. | |
| S ( 190 deg true ) | |
| 7.8 kts | |
| 9.7 kts | |
| 30.33 in | |
| 65.8 °F | |
| 61.9 °F | |
| 35.92 psu | |
| 62.6 °F | |
| 7.8 kts | |
| 9.7 kts | |
| TIME (EDT) |
WDIR |
WSPD kts |
GST kts |
WVHT ft |
DPD sec |
APD sec |
MWD |
PRES in |
PTDY in |
ATMP °F |
WTMP °F |
DEWP °F |
SAL psu |
VIS nmi |
TIDE ft |
|---|---|---|---|---|---|---|---|---|---|---|---|---|---|---|---|
| 2025-03-28 02:08 pm | S | 5.8 | 7.8 | - | - | - | - | 30.36 | - | 65.7 | 61.2 | 62.1 | 35.90 | - | - |
| 2025-03-28 01:08 pm | S | 5.8 | 7.8 | - | - | - | - | 30.38 | - | 65.5 | 60.8 | 61.0 | 35.89 | - | - |
| 2025-03-28 12:08 pm | SSE | 5.8 | 7.8 | - | - | - | - | 30.40 | - | 65.3 | 60.4 | 60.1 | 35.88 | - | - |
| 2025-03-28 11:08 am | S | 7.8 | 9.7 | - | - | - | - | 30.41 | - | 64.9 | 60.3 | 59.9 | 35.90 | - | - |
| 2025-03-28 10:08 am | S | 5.8 | 9.7 | - | - | - | - | 30.41 | - | 65.1 | 60.4 | 59.0 | 35.94 | - | - |
| 2025-03-28 09:08 am | S | 7.8 | 13.6 | - | - | - | - | 30.40 | - | 65.1 | 60.6 | 57.2 | 35.96 | - | - |
| 2025-03-28 08:08 am | S | 9.7 | 11.7 | - | - | - | - | 30.38 | - | 64.8 | 60.8 | 55.4 | 35.98 | - | - |
| 2025-03-28 07:08 am | SSE | 7.8 | 9.7 | - | - | - | - | 30.36 | - | 64.2 | 60.8 | 55.4 | 35.98 | - | - |
| 2025-03-28 06:08 am | SSE | 5.8 | 9.7 | - | - | - | - | 30.35 | - | 64.0 | 60.8 | 54.9 | 35.97 | - | - |
| 2025-03-28 05:08 am | SSE | 7.8 | 11.7 | - | - | - | - | 30.33 | - | 63.9 | 60.6 | 52.2 | 35.97 | - | - |
| 2025-03-28 04:08 am | SSE | 9.7 | 13.6 | - | - | - | - | 30.33 | - | 63.7 | 60.4 | 49.8 | 35.95 | - | - |
| 2025-03-28 03:08 am | SSE | 11.7 | 15.5 | - | - | - | - | 30.35 | - | 63.1 | 60.3 | 48.4 | 35.92 | - | - |
| 2025-03-28 02:08 am | SE | 9.7 | 15.5 | - | - | - | - | 30.35 | - | 62.8 | 60.3 | 48.4 | 35.93 | - | - |
| 2025-03-28 01:08 am | SE | 9.7 | 13.6 | - | - | - | - | 30.36 | - | 62.8 | 60.4 | 46.9 | 35.93 | - | - |
| 2025-03-28 12:08 am | SE | 11.7 | 15.5 | - | - | - | - | 30.36 | - | 62.4 | 60.6 | 45.7 | 35.95 | - | - |
| 2025-03-27 11:08 pm | SE | 9.7 | 15.5 | - | - | - | - | 30.36 | - | 61.9 | 61.0 | 45.7 | 35.98 | - | - |
| 2025-03-27 10:08 pm | SSE | 9.7 | 13.6 | - | - | - | - | 30.36 | - | 61.7 | 61.3 | 46.9 | 36.01 | - | - |
| 2025-03-27 09:08 pm | ESE | 5.8 | 9.7 | - | - | - | - | 30.35 | - | 62.1 | 61.5 | 45.9 | 36.02 | - | - |
| 2025-03-27 08:08 pm | ENE | 7.8 | 9.7 | - | - | - | - | 30.33 | - | 61.2 | 61.7 | 45.0 | 36.03 | - | - |
| 2025-03-27 07:08 pm | E | 7.8 | 9.7 | - | - | - | - | 30.32 | - | 60.6 | 61.9 | 43.2 | 36.03 | - | - |
| 2025-03-27 06:08 pm | ENE | 9.7 | 13.6 | - | - | - | - | 30.32 | - | 60.1 | 61.7 | 41.5 | 36.02 | - | - |
| 2025-03-27 05:08 pm | NE | 7.8 | 9.7 | - | - | - | - | 30.33 | - | 59.2 | 61.7 | 38.7 | 36.01 | - | - |
|
These oceanographic data are displayed in rounded times. Click on the graph icon in the table below to see a time series plot of the last five days of that observation. | |
| Depth (DEPTH): | 0.0 ft |
| 61.88 °F | |
| 35.92 psu | |
| TIME (EDT) |
DEPTH ft |
OTMP °F |
COND mS/cm |
SAL psu |
O2% % |
O2PPM ppm |
CLCON ug/l |
TURB FTU |
PH |
EH mv |
|---|---|---|---|---|---|---|---|---|---|---|
| 2025-03-28 02:08 pm | 0.0 | 61.18 | - | 35.90 | - | - | - | - | - | - |
| 2025-03-28 01:08 pm | 0.0 | 60.73 | - | 35.89 | - | - | - | - | - | - |
| 2025-03-28 12:08 pm | 0.0 | 60.48 | - | 35.88 | - | - | - | - | - | - |
| 2025-03-28 11:08 am | 0.0 | 60.26 | - | 35.90 | - | - | - | - | - | - |
| 2025-03-28 10:08 am | 0.0 | 60.46 | - | 35.94 | - | - | - | - | - | - |
| 2025-03-28 09:08 am | 0.0 | 60.64 | - | 35.96 | - | - | - | - | - | - |
| 2025-03-28 08:08 am | 0.0 | 60.75 | - | 35.98 | - | - | - | - | - | - |
| 2025-03-28 07:08 am | 0.0 | 60.76 | - | 35.98 | - | - | - | - | - | - |
| 2025-03-28 06:08 am | 0.0 | 60.73 | - | 35.97 | - | - | - | - | - | - |
| 2025-03-28 05:08 am | 0.0 | 60.62 | - | 35.97 | - | - | - | - | - | - |
| 2025-03-28 04:08 am | 0.0 | 60.40 | - | 35.95 | - | - | - | - | - | - |
| 2025-03-28 03:08 am | 0.0 | 60.17 | - | 35.92 | - | - | - | - | - | - |
| 2025-03-28 02:08 am | 0.0 | 60.28 | - | 35.93 | - | - | - | - | - | - |
| 2025-03-28 01:08 am | 0.0 | 60.37 | - | 35.93 | - | - | - | - | - | - |
| 2025-03-28 12:08 am | 0.0 | 60.64 | - | 35.95 | - | - | - | - | - | - |
| 2025-03-27 11:08 pm | 0.0 | 60.96 | - | 35.98 | - | - | - | - | - | - |
| 2025-03-27 10:08 pm | 0.0 | 61.41 | - | 36.01 | - | - | - | - | - | - |
| 2025-03-27 09:08 pm | 0.0 | 61.50 | - | 36.02 | - | - | - | - | - | - |
| 2025-03-27 08:08 pm | 0.0 | 61.70 | - | 36.03 | - | - | - | - | - | - |
| 2025-03-27 07:08 pm | 0.0 | 61.79 | - | 36.03 | - | - | - | - | - | - |
| 2025-03-27 06:08 pm | 0.0 | 61.77 | - | 36.02 | - | - | - | - | - | - |
| 2025-03-27 05:08 pm | 0.0 | 61.61 | - | 36.01 | - | - | - | - | - | - |
Links which are specific to this station are listed below:
Real Time Data in tabular form for the last forty-five days.
Historical Data & Climatic Summaries for quality controlled data for prior months and years.