


![]() View the latest observations near East Pacific Tropical Storm Flossie.
View the latest observations near East Pacific Tropical Storm Flossie.
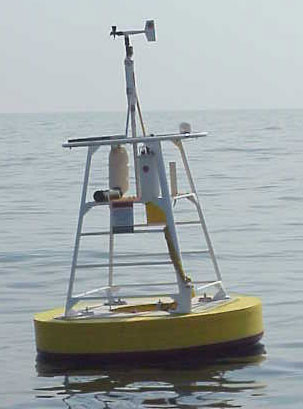
Station 42022 - C12 - WFS Central Buoy, 50m Isobath 
Owned and maintained by COMPS (University of South Florida)
Offshore Buoy
27.505 N 83.741 W (27°30'18" N 83°44'28" W)
Site elevation: sea level
Air temp height: 2 m above site elevation
Anemometer height: 3.1 m above site elevation
Barometer elevation: 1.9 m above mean sea level
Sea temp depth: 1 m below water line
Water depth: 50 m
Latest NWS Marine Forecast 1 and Latest NWS Marine Forecast 2
(24 hours for tsunami stations)
|
Click on the graph icon in the table below to see a time series plot of the last five days of that observation. | |
| 30.07 in | |
| 81.7 °F | |
| TIME (CDT) |
WDIR |
WSPD kts |
GST kts |
WVHT ft |
DPD sec |
APD sec |
MWD |
PRES in |
PTDY in |
ATMP °F |
WTMP °F |
DEWP °F |
SAL psu |
VIS nmi |
TIDE ft |
|---|---|---|---|---|---|---|---|---|---|---|---|---|---|---|---|
| 2025-06-30 05:05 pm | - | - | - | - | - | - | - | 30.07 | - | - | 81.7 | - | - | - | - |
| 2025-06-30 04:35 pm | SW | 9.7 | 11.7 | - | - | - | - | 30.10 | - | 80.4 | - | 73.2 | - | - | - |
| 2025-06-30 04:05 pm | SSW | 11.7 | 15.5 | - | - | - | - | 30.11 | - | 80.6 | - | 72.5 | - | - | - |
| 2025-06-30 03:35 pm | S | 9.7 | 11.7 | - | - | - | - | 30.11 | - | 80.4 | - | 72.9 | - | - | - |
| 2025-06-30 03:05 pm | S | 11.7 | 13.6 | - | - | - | - | 30.11 | - | 79.9 | - | 73.4 | - | - | - |
| 2025-06-30 02:35 pm | SSE | 11.7 | 13.6 | - | - | - | - | 30.11 | - | 79.7 | - | 72.5 | - | - | - |
| 2025-06-30 02:05 pm | SSE | 11.7 | 15.5 | - | - | - | - | 30.13 | - | 78.8 | - | 73.2 | - | - | - |
| 2025-06-30 01:35 pm | SSE | 11.7 | 17.5 | - | - | - | - | 30.15 | - | 78.8 | - | 72.3 | - | - | - |
| 2025-06-30 01:05 pm | ESE | 9.7 | 11.7 | - | - | - | - | 30.14 | - | 78.4 | - | 71.6 | - | - | - |
| 2025-06-30 12:35 pm | SE | 9.7 | 9.7 | - | - | - | - | 30.14 | - | 78.6 | - | 70.7 | - | - | - |
| 2025-06-30 12:05 pm | SE | 7.8 | 9.7 | - | - | - | - | 30.13 | - | 77.5 | - | 70.2 | - | - | - |
| 2025-06-30 11:35 am | ESE | 9.7 | 13.6 | - | - | - | - | 30.14 | - | 76.8 | - | 69.4 | - | - | - |
| 2025-06-30 11:05 am | SE | 13.6 | 15.5 | - | - | - | - | 30.15 | - | 75.4 | - | 71.4 | - | - | - |
| 2025-06-30 10:35 am | SE | 11.7 | 15.5 | - | - | - | - | 30.17 | - | 73.4 | - | 71.4 | - | - | - |
| 2025-06-30 10:05 am | S | 3.9 | 15.5 | - | - | - | - | 30.19 | - | 71.2 | - | 70.3 | - | - | - |
| 2025-06-30 09:35 am | NNW | 19.4 | 27.2 | - | - | - | - | 30.18 | - | 73.6 | - | 72.9 | - | - | - |
| 2025-06-30 09:05 am | N | 21.4 | 27.2 | - | - | - | - | 30.14 | - | - | - | - | - | - | - |
| 2025-06-30 08:35 am | SSE | 11.7 | 15.5 | - | - | - | - | 30.11 | - | 83.1 | - | 76.8 | - | - | - |
| 2025-06-30 08:05 am | S | 9.7 | 11.7 | - | - | - | - | 30.10 | - | 83.3 | - | 77.0 | - | - | - |
| 2025-06-30 07:35 am | S | 9.7 | 13.6 | - | - | - | - | 30.10 | - | 83.5 | - | 77.5 | - | - | - |
| 2025-06-30 07:05 am | S | 9.7 | 11.7 | - | - | - | - | 30.09 | - | 83.5 | - | 77.7 | - | - | - |
| 2025-06-30 06:35 am | S | 9.7 | 11.7 | - | - | - | - | 30.08 | - | 83.3 | - | 77.5 | - | - | - |
| 2025-06-30 06:05 am | S | 9.7 | 11.7 | - | - | - | - | 30.07 | - | 83.3 | - | 77.7 | - | - | - |
| 2025-06-30 05:35 am | S | 9.7 | 11.7 | - | - | - | - | 30.06 | - | 83.1 | - | 77.4 | - | - | - |
| 2025-06-30 05:05 am | S | 9.7 | 11.7 | - | - | - | - | 30.06 | - | 83.1 | - | 77.7 | - | - | - |
| 2025-06-30 04:35 am | S | 7.8 | 9.7 | - | - | - | - | 30.06 | - | 83.5 | - | 77.2 | - | - | - |
| 2025-06-30 04:05 am | S | 7.8 | 11.7 | - | - | - | - | 30.06 | - | 83.5 | - | 76.8 | - | - | - |
| 2025-06-30 03:35 am | S | 5.8 | 9.7 | - | - | - | - | 30.06 | - | 83.5 | - | 76.3 | - | - | - |
| 2025-06-30 03:05 am | S | 5.8 | 7.8 | - | - | - | - | 30.06 | - | 83.7 | - | 75.7 | - | - | - |
| 2025-06-30 02:35 am | S | 5.8 | 7.8 | - | - | - | - | 30.08 | - | 83.3 | - | 76.1 | - | - | - |
| 2025-06-30 02:05 am | SSE | 7.8 | 9.7 | - | - | - | - | 30.08 | - | 83.3 | - | 76.5 | - | - | - |
| 2025-06-30 01:35 am | SSE | 7.8 | 9.7 | - | - | - | - | 30.09 | - | 83.1 | - | 76.3 | - | - | - |
| 2025-06-30 01:05 am | SE | 7.8 | 9.7 | - | - | - | - | 30.09 | - | 82.9 | - | 76.6 | - | - | - |
| 2025-06-30 12:35 am | SSE | 9.7 | 11.7 | - | - | - | - | 30.10 | - | 82.9 | - | 76.5 | - | - | - |
| 2025-06-30 12:05 am | SSE | 7.8 | 9.7 | - | - | - | - | 30.11 | - | 82.9 | - | 76.5 | - | - | - |
| 2025-06-29 11:35 pm | SE | 7.8 | 9.7 | - | - | - | - | 30.12 | - | 82.9 | - | 76.1 | - | - | - |
| 2025-06-29 11:05 pm | SE | 7.8 | 9.7 | - | - | - | - | 30.12 | - | 82.6 | - | 75.6 | - | - | - |
| 2025-06-29 10:35 pm | ESE | 5.8 | 7.8 | - | - | - | - | 30.12 | - | 82.4 | - | 75.6 | - | - | - |
| 2025-06-29 10:05 pm | SE | 5.8 | 7.8 | - | - | - | - | 30.11 | - | 82.0 | - | 75.4 | - | - | - |
| 2025-06-29 09:35 pm | SE | 5.8 | 7.8 | - | - | - | - | 30.11 | - | 81.7 | - | 75.0 | - | - | - |
| 2025-06-29 09:05 pm | SE | 5.8 | 7.8 | - | - | - | - | 30.10 | - | 81.5 | - | 75.7 | - | - | - |
| 2025-06-29 08:35 pm | SE | 5.8 | 7.8 | - | - | - | - | 30.09 | - | 81.1 | - | 75.9 | - | - | - |
| 2025-06-29 08:05 pm | ESE | 5.8 | 7.8 | - | - | - | - | 30.08 | - | 81.1 | - | 75.6 | - | - | - |
| 2025-06-29 07:35 pm | E | 5.8 | 9.7 | - | - | - | - | 30.08 | - | 81.1 | - | 75.0 | - | - | - |
| 2025-06-29 07:05 pm | E | 3.9 | 5.8 | - | - | - | - | 30.09 | - | 81.0 | - | 74.8 | - | - | - |
Links which are specific to this station are listed below:
Real Time Data in tabular form for the last forty-five days.
Historical Data & Climatic Summaries for quality controlled data for prior months and years.