


NDBC has recently revised the NDBC Handbook of Automated Data Quality Control Checks and Procedures. The new document can be found on our Publications page.
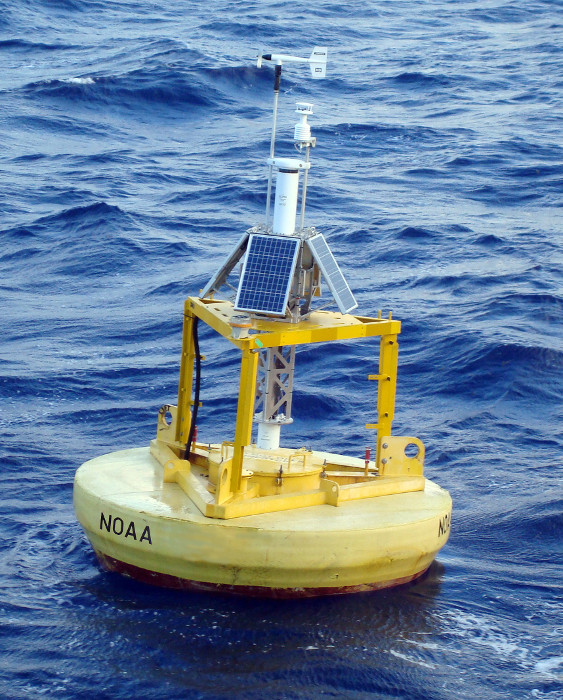
Station 42056 (LLNR 80) - Yucatan Basin - 120 NM ESE of Cozumel, MX 
Owned and maintained by National Data Buoy Center
3-meter foam buoy
SCOOP payload
19.820 N 84.980 W (19°49'12" N 84°58'48" W)
Site elevation: sea level
Air temp height: 3.7 m above site elevation
Anemometer height: 4.1 m above site elevation
Barometer elevation: 2.7 m above mean sea level
Sea temp depth: 1.5 m below water line
Water depth: 4578 m
Watch circle radius: 4502 yards
(24 hours for tsunami stations)

|
Click on the graph icon in the table below to see a time series plot of the last five days of that observation. | |
| E ( 90 deg true ) | |
| 15.5 kts | |
| 19.4 kts | |
| 5.6 ft | |
| 5.2 sec | |
| E ( 96 deg true ) | |
| 29.97 in | |
| 80.4 °F | |
| 81.5 °F | |
| 73.8 °F | |
| 85.1 °F | |
| 17.5 kts | |
| 17.5 kts | |
|
||||||||||||||||||
| TIME (EDT) |
WDIR |
WSPD kts |
GST kts |
WVHT ft |
DPD sec |
APD sec |
MWD |
PRES in |
PTDY in |
ATMP °F |
WTMP °F |
DEWP °F |
SAL psu |
VIS nmi |
TIDE ft |
|---|---|---|---|---|---|---|---|---|---|---|---|---|---|---|---|
| 2025-03-29 12:00 am | E | 15.5 | 19.4 | - | - | - | - | 29.97 | +0.02 | 80.4 | 81.5 | 73.4 | - | - | - |
| 2025-03-28 11:50 pm | E | 15.5 | 19.4 | 5.6 | 8 | 5.1 | E | 29.97 | - | 80.4 | 81.5 | 73.6 | - | - | - |
| 2025-03-28 11:40 pm | E | 15.5 | 17.5 | 5.6 | - | 5.1 | E | 29.97 | - | 80.6 | 81.5 | 73.8 | - | - | - |
| 2025-03-28 11:30 pm | E | 15.5 | 19.4 | - | - | - | - | 29.97 | - | 80.6 | 81.5 | 73.6 | - | - | - |
| 2025-03-28 11:20 pm | E | 15.5 | 19.4 | 5.6 | 8 | 5.1 | E | 29.97 | - | 80.4 | 81.5 | 73.2 | - | - | - |
| 2025-03-28 11:10 pm | E | 15.5 | 17.5 | 5.6 | - | 5.1 | E | 29.97 | - | 80.4 | 81.5 | 73.4 | - | - | - |
| 2025-03-28 11:00 pm | E | 15.5 | 19.4 | - | - | - | - | 29.97 | +0.04 | 80.4 | 81.5 | 73.8 | - | - | - |
| 2025-03-28 10:50 pm | E | 15.5 | 19.4 | 5.6 | 8 | 5.1 | E | 29.97 | - | 80.6 | 81.5 | 73.8 | - | - | - |
| 2025-03-28 10:40 pm | E | 17.5 | 19.4 | - | - | - | - | 29.97 | - | 80.4 | 81.5 | 73.4 | - | - | - |
| 2025-03-28 10:30 pm | E | 17.5 | 19.4 | - | - | - | - | 29.96 | - | 80.6 | 81.5 | 73.4 | - | - | - |
| 2025-03-28 10:20 pm | E | 17.5 | 19.4 | 5.9 | 8 | 5.2 | E | 29.96 | - | 80.6 | 81.5 | 73.4 | - | - | - |
| 2025-03-28 10:10 pm | E | 17.5 | 19.4 | 5.9 | - | 5.2 | E | 29.96 | - | 80.6 | 81.5 | 73.2 | - | - | - |
| 2025-03-28 10:00 pm | E | 17.5 | 19.4 | - | - | - | - | 29.96 | +0.04 | 80.6 | 81.5 | 72.9 | - | - | - |
| 2025-03-28 09:50 pm | E | 15.5 | 19.4 | 5.6 | 8 | 5.1 | E | 29.95 | - | 80.6 | 81.5 | 73.2 | - | - | - |
| 2025-03-28 09:40 pm | E | 17.5 | 21.4 | - | - | - | - | 29.95 | - | 80.6 | 81.5 | 73.0 | - | - | - |
| 2025-03-28 09:30 pm | E | 17.5 | 19.4 | - | - | - | - | 29.95 | - | 80.4 | 81.5 | 73.0 | - | - | - |
| 2025-03-28 09:20 pm | E | 17.5 | 19.4 | 5.9 | 8 | 5.4 | E | 29.95 | - | 80.4 | 81.5 | 72.7 | - | - | - |
| 2025-03-28 09:10 pm | E | 17.5 | 21.4 | - | - | - | - | 29.95 | - | 80.4 | 81.5 | 72.9 | - | - | - |
| 2025-03-28 09:00 pm | E | 17.5 | 19.4 | - | - | - | - | 29.95 | +0.03 | 80.6 | 81.5 | 73.2 | - | - | - |
| 2025-03-28 08:50 pm | E | 17.5 | 19.4 | 6.2 | 8 | 5.3 | E | 29.94 | - | 80.6 | 81.5 | 72.9 | - | - | - |
| 2025-03-28 08:40 pm | E | 17.5 | 21.4 | - | - | - | - | 29.94 | - | 80.6 | 81.7 | 72.9 | - | - | - |
| 2025-03-28 08:30 pm | E | 17.5 | 21.4 | - | - | - | - | 29.94 | - | 80.4 | 81.7 | 72.7 | - | - | - |
| 2025-03-28 08:20 pm | E | 17.5 | 19.4 | 6.2 | 7 | 5.2 | E | 29.94 | - | 80.6 | 81.7 | 72.9 | - | - | - |
| 2025-03-28 08:10 pm | E | 17.5 | 21.4 | 6.2 | - | 5.2 | E | 29.93 | - | 80.6 | 81.7 | 72.5 | - | - | - |
| 2025-03-28 08:00 pm | E | 17.5 | 21.4 | - | - | - | - | 29.93 | +0.00 | 80.4 | 81.5 | 72.7 | - | - | - |
| 2025-03-28 07:50 pm | E | 17.5 | 21.4 | 6.6 | 8 | 5.4 | E | 29.92 | - | 80.6 | 81.5 | 73.4 | - | - | - |
| 2025-03-28 07:40 pm | E | 17.5 | 21.4 | - | - | - | - | 29.92 | - | 80.6 | 81.5 | 73.2 | - | - | - |
| 2025-03-28 07:10 pm | E | 19.4 | 23.3 | 5.9 | - | 5.1 | E | 29.92 | - | 80.6 | 81.5 | 72.9 | - | - | - |
| 2025-03-28 07:00 pm | E | 19.4 | 21.4 | - | - | - | - | 29.91 | -0.03 | 80.6 | 81.7 | 73.0 | - | - | - |
| 2025-03-28 06:50 pm | E | 17.5 | 21.4 | 5.9 | 8 | 5.4 | E | 29.92 | - | 80.8 | 81.7 | 73.2 | - | - | - |
| 2025-03-28 06:40 pm | E | 17.5 | 21.4 | - | - | - | - | 29.92 | - | 80.8 | 81.7 | 73.2 | - | - | - |
| 2025-03-28 06:30 pm | E | 17.5 | 19.4 | - | - | - | - | 29.91 | - | 80.8 | 81.7 | 72.7 | - | - | - |
| 2025-03-28 06:20 pm | E | 17.5 | 21.4 | 5.9 | 7 | 5.3 | E | 29.91 | - | 80.8 | 81.7 | 73.0 | - | - | - |
| 2025-03-28 06:10 pm | E | 17.5 | 19.4 | 5.9 | - | 5.3 | E | 29.91 | - | 81.0 | 81.7 | 72.5 | - | - | - |
| 2025-03-28 06:00 pm | E | 17.5 | 19.4 | - | - | - | - | 29.92 | -0.05 | 81.0 | 81.7 | 72.5 | - | - | - |
| 2025-03-28 05:50 pm | E | 17.5 | 21.4 | 5.9 | 8 | 5.3 | E | 29.91 | - | 80.6 | - | 72.9 | - | - | - |
| 2025-03-28 05:40 pm | E | 19.4 | 21.4 | 5.9 | - | 5.3 | E | 29.92 | - | 80.6 | 81.7 | 73.2 | - | - | - |
| 2025-03-28 05:30 pm | E | 17.5 | 21.4 | - | - | - | - | 29.92 | - | 80.8 | 81.5 | 73.4 | - | - | - |
| 2025-03-28 05:20 pm | E | 17.5 | 21.4 | 6.2 | 7 | 5.3 | E | 29.92 | - | 80.8 | 81.5 | 73.0 | - | - | - |
| 2025-03-28 05:10 pm | E | 17.5 | 19.4 | 6.2 | - | 5.3 | E | 29.92 | - | 80.6 | 81.5 | 72.9 | - | - | - |
| 2025-03-28 05:00 pm | E | 17.5 | 19.4 | - | - | - | - | 29.93 | -0.06 | 80.8 | 81.7 | 72.9 | - | - | - |
| 2025-03-28 04:50 pm | E | 17.5 | 19.4 | 5.9 | 7 | 5.2 | E | 29.93 | - | 80.8 | 81.7 | 72.5 | - | - | - |
| 2025-03-28 04:40 pm | E | 17.5 | 21.4 | - | - | - | - | 29.93 | - | 80.8 | 81.7 | 72.5 | - | - | - |
| 2025-03-28 04:30 pm | E | 17.5 | 19.4 | - | - | - | - | 29.94 | - | 80.8 | 81.7 | 72.5 | - | - | - |
| 2025-03-28 04:20 pm | E | 17.5 | 19.4 | 6.2 | 8 | 5.4 | ESE | 29.93 | - | 80.6 | 81.7 | 72.1 | - | - | - |
| 2025-03-28 04:10 pm | E | 17.5 | 19.4 | 6.2 | - | 5.4 | ESE | 29.94 | - | 80.6 | 81.5 | 71.8 | - | - | - |
| 2025-03-28 04:00 pm | E | 17.5 | 21.4 | - | - | - | - | 29.94 | -0.06 | 80.6 | 81.5 | 72.0 | - | - | - |
| 2025-03-28 03:50 pm | E | 17.5 | 19.4 | 6.2 | 7 | 5.0 | E | 29.95 | - | 80.6 | 81.5 | 72.0 | - | - | - |
| 2025-03-28 03:40 pm | E | 17.5 | 21.4 | 6.2 | - | 5.0 | E | 29.96 | - | 80.6 | 81.5 | 72.1 | - | - | - |
| 2025-03-28 03:30 pm | E | 17.5 | 21.4 | - | - | - | - | 29.96 | - | 80.6 | 81.5 | 71.8 | - | - | - |
| 2025-03-28 03:20 pm | E | 17.5 | 21.4 | 5.9 | 7 | 5.2 | E | 29.96 | - | 80.6 | 81.5 | 72.0 | - | - | - |
| 2025-03-28 03:10 pm | E | 17.5 | 21.4 | 5.9 | - | 5.2 | E | 29.97 | - | 80.6 | 81.5 | 71.8 | - | - | - |
| 2025-03-28 03:00 pm | E | 17.5 | 21.4 | - | - | - | - | 29.97 | -0.05 | 80.6 | 81.5 | 72.0 | - | - | - |
| 2025-03-28 02:50 pm | E | 17.5 | 21.4 | 6.6 | 8 | 5.3 | E | 29.97 | - | 80.6 | 81.5 | 71.2 | - | - | - |
| 2025-03-28 02:40 pm | E | 17.5 | 21.4 | - | - | - | - | 29.97 | - | 80.6 | 81.5 | 71.6 | - | - | - |
| 2025-03-28 02:30 pm | E | 17.5 | 21.4 | - | - | - | - | 29.98 | - | 80.6 | 81.5 | 71.4 | - | - | - |
| 2025-03-28 02:20 pm | E | 17.5 | 21.4 | 6.9 | 8 | 5.4 | E | 29.98 | - | 80.6 | 81.5 | 72.0 | - | - | - |
| 2025-03-28 02:10 pm | E | 17.5 | 21.4 | 6.9 | - | 5.4 | E | 29.98 | - | 80.6 | 81.5 | 72.0 | - | - | - |
| 2025-03-28 02:00 pm | E | 17.5 | 21.4 | - | - | - | - | 29.99 | -0.02 | 80.4 | 81.5 | 71.8 | - | - | - |
| 2025-03-28 01:50 pm | E | 19.4 | 23.3 | 6.6 | 7 | 5.2 | E | 29.99 | - | 80.4 | 81.5 | 72.0 | - | - | - |
| 2025-03-28 01:40 pm | E | 17.5 | 21.4 | - | - | - | - | 30.00 | - | 80.6 | 81.5 | 72.0 | - | - | - |
| 2025-03-28 01:30 pm | E | 17.5 | 21.4 | - | - | - | - | 30.00 | - | 80.6 | 81.5 | 71.8 | - | - | - |
| 2025-03-28 01:20 pm | E | 17.5 | 21.4 | 6.9 | 8 | 5.3 | E | 30.01 | - | 80.6 | 81.5 | 71.8 | - | - | - |
| 2025-03-28 01:10 pm | E | 17.5 | 21.4 | 6.9 | - | 5.3 | E | 30.01 | - | 80.6 | 81.5 | 72.0 | - | - | - |
| 2025-03-28 01:00 pm | E | 19.4 | 23.3 | - | - | - | - | 30.01 | +0.00 | 80.4 | 81.5 | 71.8 | - | - | - |
| 2025-03-28 12:50 pm | E | 17.5 | 21.4 | 6.6 | 7 | 5.3 | E | 30.01 | - | 80.6 | 81.5 | 72.3 | - | - | - |
| 2025-03-28 12:40 pm | E | 17.5 | 21.4 | - | - | - | - | 30.01 | - | 80.6 | 81.5 | 71.6 | - | - | - |
| 2025-03-28 12:30 pm | E | 19.4 | 23.3 | - | - | - | - | 30.01 | - | 80.4 | 81.5 | 71.1 | - | - | - |
| 2025-03-28 12:20 pm | E | 19.4 | 23.3 | 6.6 | 7 | 5.3 | E | 30.01 | - | 80.4 | 81.5 | 71.8 | - | - | - |
| 2025-03-28 12:10 pm | E | 19.4 | 23.3 | 6.6 | - | 5.3 | E | 30.01 | - | 80.4 | 81.3 | 71.8 | - | - | - |
| 2025-03-28 12:00 pm | E | 19.4 | 23.3 | - | - | - | - | 30.01 | +0.03 | 80.4 | 81.3 | 71.8 | - | - | - |
| 2025-03-28 11:50 am | E | 21.4 | 23.3 | 6.6 | - | 5.2 | E | 30.01 | - | 80.6 | 81.3 | 71.8 | - | - | - |
| 2025-03-28 11:40 am | E | 21.4 | 23.3 | 6.6 | - | 5.2 | E | 30.01 | - | 80.6 | 81.3 | 71.2 | - | - | - |
| 2025-03-28 11:30 am | E | 19.4 | 23.3 | - | - | - | - | 30.01 | - | 80.6 | 81.3 | 72.1 | - | - | - |
| 2025-03-28 11:20 am | E | 19.4 | 23.3 | 6.6 | 8 | 5.2 | E | 30.01 | - | 80.6 | 81.3 | 72.3 | - | - | - |
| 2025-03-28 11:10 am | E | 19.4 | 23.3 | 6.6 | - | 5.2 | E | 30.01 | - | 80.6 | 81.3 | 71.8 | - | - | - |
| 2025-03-28 11:00 am | E | 21.4 | 25.3 | - | - | - | - | 30.01 | +0.04 | 80.4 | 81.3 | 71.4 | - | - | - |
| 2025-03-28 10:50 am | E | 19.4 | 23.3 | 6.6 | 8 | 5.3 | E | 30.01 | - | 80.4 | 81.3 | 71.8 | - | - | - |
| 2025-03-28 10:40 am | E | 19.4 | 23.3 | - | - | - | - | 30.01 | - | 80.6 | 81.3 | 72.1 | - | - | - |
| 2025-03-28 10:30 am | E | 19.4 | 23.3 | - | - | - | - | 30.01 | - | 80.6 | 81.3 | 72.0 | - | - | - |
| 2025-03-28 10:20 am | E | 19.4 | 23.3 | 7.2 | 8 | 5.4 | E | 30.01 | - | 80.8 | 81.5 | 71.8 | - | - | - |
| 2025-03-28 10:10 am | E | 19.4 | 23.3 | 7.2 | - | 5.4 | E | 30.01 | - | 80.6 | 81.5 | 71.8 | - | - | - |
| 2025-03-28 10:00 am | E | 19.4 | 23.3 | - | - | - | - | 30.01 | +0.05 | 80.6 | 81.5 | 72.1 | - | - | - |
| 2025-03-28 09:50 am | E | 19.4 | 23.3 | 6.2 | 8 | 5.1 | E | 30.01 | - | 80.6 | 81.5 | 71.8 | - | - | - |
| 2025-03-28 09:40 am | E | 19.4 | 25.3 | - | - | - | - | 30.00 | - | 80.6 | 81.5 | 71.8 | - | - | - |
| 2025-03-28 09:30 am | E | 19.4 | 23.3 | - | - | - | - | 30.00 | - | 80.6 | 81.5 | 72.0 | - | - | - |
| 2025-03-28 09:20 am | E | 19.4 | 23.3 | 6.2 | 7 | 5.1 | E | 29.99 | - | 80.6 | 81.5 | 72.0 | - | - | - |
| 2025-03-28 09:10 am | E | 19.4 | 23.3 | 6.2 | - | 5.1 | E | 29.99 | - | 80.6 | 81.5 | 72.3 | - | - | - |
| 2025-03-28 09:00 am | E | 19.4 | 23.3 | - | - | - | - | 29.99 | +0.04 | 80.4 | 81.5 | 72.9 | - | - | - |
| 2025-03-28 08:50 am | E | 17.5 | 21.4 | 6.2 | 8 | 5.0 | E | 29.99 | - | 80.6 | 81.5 | 72.7 | - | - | - |
| 2025-03-28 08:40 am | E | 19.4 | 23.3 | - | - | - | - | 29.98 | - | 80.4 | 81.5 | 72.1 | - | - | - |
| 2025-03-28 08:30 am | E | 19.4 | 23.3 | - | - | - | - | 29.98 | - | 80.4 | 81.5 | 72.0 | - | - | - |
| 2025-03-28 08:20 am | E | 19.4 | 23.3 | 6.2 | 7 | 5.2 | E | 29.97 | - | 80.2 | 81.5 | 71.8 | - | - | - |
| 2025-03-28 08:10 am | E | 17.5 | 23.3 | 6.2 | - | 5.2 | E | 29.98 | - | 80.4 | 81.5 | 72.3 | - | - | - |
| 2025-03-28 08:00 am | E | 17.5 | 21.4 | - | - | - | - | 29.97 | +0.03 | 80.4 | 81.5 | 72.3 | - | - | - |
| 2025-03-28 07:50 am | E | 19.4 | 21.4 | 6.2 | 8 | 5.2 | E | 29.97 | - | 80.4 | 81.5 | 72.7 | - | - | - |
| 2025-03-28 07:40 am | E | 19.4 | 21.4 | - | - | - | - | 29.97 | - | 80.4 | 81.5 | 72.9 | - | - | - |
| 2025-03-28 07:30 am | E | 19.4 | 23.3 | - | - | - | - | 29.97 | - | 80.2 | 81.5 | 72.7 | - | - | - |
| 2025-03-28 07:20 am | E | 17.5 | 21.4 | 5.9 | 6 | 4.9 | E | 29.96 | - | 80.2 | 81.7 | 72.5 | - | - | - |
| 2025-03-28 07:10 am | E | 19.4 | 23.3 | 5.9 | - | 4.9 | E | 29.96 | - | 80.6 | 81.7 | 72.1 | - | - | - |
| 2025-03-28 07:00 am | E | 19.4 | 21.4 | - | - | - | - | 29.96 | +0.00 | 80.6 | 81.7 | 72.1 | - | - | - |
| 2025-03-28 06:50 am | E | 19.4 | 23.3 | 5.9 | 8 | 5.1 | ESE | 29.96 | - | 80.8 | 81.7 | 72.5 | - | - | - |
| 2025-03-28 06:40 am | E | 19.4 | 23.3 | - | - | - | - | 29.96 | - | 80.8 | 81.5 | 71.6 | - | - | - |
| 2025-03-28 06:30 am | E | 19.4 | 23.3 | - | - | - | - | 29.95 | - | 80.8 | 81.7 | 72.3 | - | - | - |
| 2025-03-28 06:20 am | E | 19.4 | 23.3 | 5.9 | 8 | 5.0 | E | 29.95 | - | 81.0 | 81.7 | 72.3 | - | - | - |
| 2025-03-28 06:10 am | E | 19.4 | 23.3 | 5.9 | - | 5.0 | E | 29.95 | - | 81.0 | 81.5 | 72.3 | - | - | - |
| 2025-03-28 06:00 am | E | 19.4 | 25.3 | - | - | - | - | 29.95 | -0.03 | 81.0 | 81.5 | 72.3 | - | - | - |
| 2025-03-28 05:50 am | E | 17.5 | 21.4 | 5.6 | 7 | 5.0 | ESE | 29.95 | - | 81.0 | 81.7 | 72.7 | - | - | - |
| 2025-03-28 05:40 am | E | 17.5 | 21.4 | - | - | - | - | 29.95 | - | 81.0 | 81.5 | 72.5 | - | - | - |
| 2025-03-28 05:30 am | E | 17.5 | 21.4 | - | - | - | - | 29.95 | - | 81.0 | 81.7 | 72.7 | - | - | - |
| 2025-03-28 05:20 am | E | 17.5 | 21.4 | 5.2 | 7 | 4.9 | E | 29.95 | - | 81.0 | 81.7 | 71.8 | - | - | - |
| 2025-03-28 05:10 am | E | 19.4 | 23.3 | 5.2 | - | 4.9 | E | 29.95 | - | 81.0 | 81.7 | 71.2 | - | - | - |
| 2025-03-28 05:00 am | E | 19.4 | 21.4 | - | - | - | - | 29.95 | -0.05 | 81.0 | 81.7 | 71.6 | - | - | - |
| 2025-03-28 04:50 am | E | 19.4 | 23.3 | 5.9 | 8 | 5.3 | E | 29.95 | - | 81.0 | 81.7 | 71.8 | - | - | - |
| 2025-03-28 04:40 am | E | 19.4 | 23.3 | - | - | - | - | 29.95 | - | 81.0 | 81.5 | 71.6 | - | - | - |
| 2025-03-28 04:30 am | E | 19.4 | 23.3 | - | - | - | - | 29.96 | - | 81.0 | 81.5 | 71.8 | - | - | - |
| 2025-03-28 04:20 am | E | 19.4 | 23.3 | 5.6 | 7 | 5.2 | E | 29.96 | - | 81.0 | 81.5 | 71.8 | - | - | - |
| 2025-03-28 04:10 am | E | 19.4 | 21.4 | 5.6 | - | 5.2 | E | 29.96 | - | 80.8 | 81.7 | 71.8 | - | - | - |
| 2025-03-28 04:00 am | E | 17.5 | 21.4 | - | - | - | - | 29.96 | -0.05 | 80.8 | 81.5 | 72.0 | - | - | - |
| 2025-03-28 03:50 am | E | 17.5 | 21.4 | 5.2 | 8 | 5.3 | E | 29.96 | - | 80.8 | 81.7 | 71.6 | - | - | - |
| 2025-03-28 03:40 am | E | 17.5 | 21.4 | - | - | - | - | 29.96 | - | 80.8 | 81.7 | 71.4 | - | - | - |
| 2025-03-28 03:30 am | E | 15.5 | 19.4 | - | - | - | - | 29.96 | - | 80.6 | 81.7 | 71.2 | - | - | - |
| 2025-03-28 03:20 am | E | 15.5 | 19.4 | 5.2 | 7 | 5.2 | E | 29.97 | - | 80.6 | 81.5 | 71.6 | - | - | - |
| 2025-03-28 03:10 am | E | 15.5 | 19.4 | 5.2 | - | 5.2 | E | 29.97 | - | 80.6 | 81.5 | 71.2 | - | - | - |
| 2025-03-28 03:00 am | E | 15.5 | 19.4 | - | - | - | - | 29.97 | -0.05 | 80.4 | 81.7 | 71.4 | - | - | - |
| 2025-03-28 02:50 am | E | 15.5 | 17.5 | 5.6 | 7 | 5.3 | E | 29.98 | - | 80.6 | 81.7 | 71.4 | - | - | - |
| 2025-03-28 02:40 am | E | 15.5 | 19.4 | - | - | - | - | 29.98 | - | 80.6 | 81.5 | 71.4 | - | - | - |
| 2025-03-28 02:30 am | E | 15.5 | 17.5 | - | - | - | - | 29.98 | - | 80.6 | 81.7 | 71.8 | - | - | - |
| 2025-03-28 02:20 am | E | 17.5 | 19.4 | 5.2 | 7 | 5.0 | ESE | 29.99 | - | 80.6 | 81.5 | 71.2 | - | - | - |
| 2025-03-28 02:10 am | E | 17.5 | 21.4 | 5.2 | - | 5.0 | ESE | 29.99 | - | 80.6 | 81.5 | 71.4 | - | - | - |
| 2025-03-28 02:00 am | E | 17.5 | 19.4 | - | - | - | - | 29.99 | -0.02 | 80.6 | 81.5 | 71.4 | - | - | - |
| 2025-03-28 01:50 am | E | 17.5 | 19.4 | 5.2 | 7 | 5.2 | E | 30.00 | - | 80.8 | 81.5 | 71.1 | - | - | - |
| 2025-03-28 01:40 am | E | 17.5 | 19.4 | - | - | - | - | 30.00 | - | 80.6 | 81.5 | 70.7 | - | - | - |
| 2025-03-28 01:30 am | E | 15.5 | 17.5 | - | - | - | - | 30.00 | - | 80.6 | 81.5 | 70.9 | - | - | - |
| 2025-03-28 01:20 am | E | 15.5 | 19.4 | 5.6 | 7 | 5.2 | E | 30.00 | - | 80.6 | 81.5 | 70.9 | - | - | - |
| 2025-03-28 01:10 am | E | 15.5 | 17.5 | 5.6 | - | 5.2 | E | 30.01 | - | 80.6 | 81.5 | 71.2 | - | - | - |
| 2025-03-28 01:00 am | E | 15.5 | 17.5 | - | - | - | - | 30.01 | +0.01 | 80.4 | 81.5 | 71.1 | - | - | - |
| 2025-03-28 12:50 am | E | 15.5 | 17.5 | 5.2 | 7 | 5.0 | E | 30.01 | - | 80.4 | 81.5 | 71.4 | - | - | - |
| 2025-03-28 12:40 am | E | 15.5 | 17.5 | - | - | - | - | 30.01 | - | 80.4 | 81.5 | 71.6 | - | - | - |
| 2025-03-28 12:30 am | E | 15.5 | 17.5 | - | - | - | - | 30.02 | - | 80.4 | 81.5 | 71.4 | - | - | - |
| 2025-03-28 12:20 am | E | 15.5 | 19.4 | 5.2 | 7 | 4.9 | E | 30.02 | - | 80.4 | 81.5 | 71.4 | - | - | - |
| 2025-03-28 12:10 am | E | 15.5 | 19.4 | - | - | - | - | 30.02 | - | 80.4 | 81.5 | 71.4 | - | - | - |
| 2025-03-28 12:00 am | E | 15.5 | 19.4 | - | - | - | - | 30.02 | +0.04 | 80.2 | 81.5 | 72.0 | - | - | - |
| 2025-03-27 11:50 pm | E | 15.5 | 19.4 | 5.6 | 6 | 5.0 | E | 30.02 | - | 80.4 | 81.5 | 71.6 | - | - | - |
|
These wave data are displayed in rounded times. Click on the graph icon in the table below to see a time series plot of the last five days of that observation. | |
| 5.6 ft | |
| 3.0 ft | |
| 8.3 sec | |
| E | |
| 4.6 ft | |
| 6.7 sec | |
| E | |
| STEEP | |
| 5.2 sec | |
| TIME (EDT) |
WVHT ft |
SwH ft |
SwP sec |
SwD |
WWH ft |
WWP sec |
WWD |
STEEPNESS |
APD sec |
|---|---|---|---|---|---|---|---|---|---|
| 2025-03-28 11:40 pm | 5.6 | 3.0 | 8.3 | E | 4.6 | 7.1 | E | AVERAGE | 5.1 |
| 2025-03-28 11:10 pm | 5.6 | 3.0 | 8.3 | E | 4.6 | 6.7 | E | AVERAGE | 5.1 |
| 2025-03-28 10:40 pm | 5.6 | 3.6 | 8.3 | E | 4.3 | 5.0 | E | AVERAGE | 5.1 |
| 2025-03-28 10:10 pm | 5.9 | 3.6 | 8.3 | E | 4.6 | 5.6 | E | AVERAGE | 5.2 |
| 2025-03-28 09:40 pm | 5.6 | 3.6 | 8.3 | E | 4.3 | 6.7 | ESE | AVERAGE | 5.1 |
| 2025-03-28 09:10 pm | 5.9 | 4.3 | 8.3 | E | 4.3 | 5.3 | E | AVERAGE | 5.4 |
| 2025-03-28 08:40 pm | 6.2 | 4.3 | 8.3 | E | 4.3 | 5.9 | E | AVERAGE | 5.3 |
| 2025-03-28 08:10 pm | 6.2 | 3.9 | 7.1 | E | 4.6 | 6.2 | E | STEEP | 5.2 |
| 2025-03-28 07:40 pm | 6.6 | 3.9 | 8.3 | E | 4.9 | 5.0 | E | AVERAGE | 5.4 |
| 2025-03-28 07:10 pm | 5.9 | 3.3 | 7.7 | E | 4.6 | 6.7 | E | STEEP | 5.1 |
| 2025-03-28 06:40 pm | 5.9 | 4.3 | 8.3 | E | 4.3 | 5.6 | E | AVERAGE | 5.4 |
| 2025-03-28 06:10 pm | 5.9 | 3.9 | 7.1 | E | 4.6 | 6.2 | ENE | STEEP | 5.3 |
| 2025-03-28 05:40 pm | 5.9 | 3.6 | 7.7 | E | 4.9 | 5.9 | E | STEEP | 5.3 |
| 2025-03-28 05:10 pm | 6.2 | 4.3 | 7.1 | E | 4.6 | 6.2 | E | STEEP | 5.3 |
| 2025-03-28 04:40 pm | 5.9 | 0.0 | - | - | 5.9 | 7.1 | E | STEEP | 5.2 |
| 2025-03-28 04:10 pm | 6.2 | 4.3 | 7.7 | ESE | 4.6 | 5.0 | E | STEEP | 5.4 |
| 2025-03-28 03:40 pm | 6.2 | 3.9 | 7.1 | E | 4.9 | 5.9 | E | STEEP | 5.0 |
| 2025-03-28 03:10 pm | 5.9 | 0.0 | - | - | 5.9 | 7.1 | E | STEEP | 5.2 |
| 2025-03-28 02:40 pm | 6.6 | 0.0 | - | - | 6.6 | 7.7 | E | STEEP | 5.3 |
| 2025-03-28 02:10 pm | 6.9 | 3.0 | 12.1 | NE | 6.2 | 7.7 | E | STEEP | 5.4 |
| 2025-03-28 01:40 pm | 6.6 | 1.3 | 12.9 | E | 6.2 | 7.1 | E | STEEP | 5.2 |
| 2025-03-28 01:10 pm | 6.9 | 0.0 | - | - | 6.9 | 8.3 | E | AVERAGE | 5.3 |
| 2025-03-28 12:40 pm | 6.6 | 0.0 | - | - | 6.6 | 7.1 | E | STEEP | 5.3 |
| 2025-03-28 12:10 pm | 6.6 | 0.0 | - | - | 6.6 | 7.1 | E | STEEP | 5.3 |
| 2025-03-28 11:40 am | 6.6 | 2.6 | 12.1 | NE | 6.2 | 7.7 | E | STEEP | 5.2 |
| 2025-03-28 11:10 am | 6.6 | 0.0 | - | - | 6.6 | 7.7 | E | STEEP | 5.2 |
| 2025-03-28 10:40 am | 6.6 | 0.0 | - | - | 6.6 | 7.7 | E | STEEP | 5.3 |
| 2025-03-28 10:10 am | 7.2 | 0.0 | - | - | 7.2 | 7.7 | E | STEEP | 5.4 |
| 2025-03-28 09:40 am | 6.2 | 0.0 | - | - | 6.2 | 7.7 | E | STEEP | 5.1 |
| 2025-03-28 09:10 am | 6.2 | 2.3 | 8.3 | E | 5.6 | 7.1 | E | STEEP | 5.1 |
| 2025-03-28 08:40 am | 6.2 | 2.6 | 9.1 | E | 5.9 | 7.7 | E | STEEP | 5.0 |
| 2025-03-28 08:10 am | 6.2 | 2.6 | 8.3 | E | 5.6 | 7.1 | E | STEEP | 5.2 |
| 2025-03-28 07:40 am | 6.2 | 3.0 | 8.3 | E | 5.6 | 7.1 | E | AVERAGE | 5.2 |
| 2025-03-28 07:10 am | 5.9 | 0.0 | - | - | 5.9 | 5.9 | E | VERY_STEEP | 4.9 |
| 2025-03-28 06:40 am | 5.9 | 0.0 | - | - | 5.9 | 7.7 | ESE | STEEP | 5.1 |
| 2025-03-28 06:10 am | 5.9 | 3.0 | 7.7 | E | 4.9 | 5.6 | E | STEEP | 5.0 |
| 2025-03-28 05:40 am | 5.6 | 3.0 | 8.3 | E | 4.6 | 7.1 | ESE | STEEP | 5.0 |
| 2025-03-28 05:10 am | 5.2 | 0.0 | - | - | 5.2 | 7.1 | E | STEEP | 4.9 |
| 2025-03-28 04:40 am | 5.9 | 4.3 | 7.7 | E | 3.9 | 4.2 | E | STEEP | 5.3 |
| 2025-03-28 04:10 am | 5.6 | 3.9 | 7.1 | E | 3.6 | 4.0 | E | STEEP | 5.2 |
| 2025-03-28 03:40 am | 5.2 | 3.3 | 7.7 | E | 3.9 | 6.7 | E | AVERAGE | 5.3 |
| 2025-03-28 03:10 am | 5.2 | 0.0 | - | - | 5.2 | 7.1 | E | STEEP | 5.2 |
| 2025-03-28 02:40 am | 5.6 | 4.3 | 7.1 | E | 3.6 | 6.2 | E | STEEP | 5.3 |
| 2025-03-28 02:10 am | 5.2 | 3.6 | 7.1 | ESE | 3.6 | 4.2 | E | STEEP | 5.0 |
| 2025-03-28 01:40 am | 5.2 | 3.6 | 7.1 | E | 3.9 | 6.2 | E | STEEP | 5.2 |
| 2025-03-28 01:10 am | 5.6 | 2.6 | 9.1 | ESE | 4.9 | 7.1 | E | STEEP | 5.2 |
| 2025-03-28 12:40 am | 5.2 | 0.0 | - | - | 5.2 | 7.1 | E | STEEP | 5.0 |
| 2025-03-28 12:10 am | 5.2 | 3.0 | 6.7 | E | 4.3 | 4.5 | E | STEEP | 4.9 |
Links which are specific to this station are listed below:
Real Time Data in tabular form for the last forty-five days.
Historical Data & Climatic Summaries for quality controlled data for prior months and years.
The weekly status report and the weekly maintenance report also provide valuable station information.
Note that the payload types and the station locations occasionally change.