


NDBC has recently revised the NDBC Handbook of Automated Data Quality Control Checks and Procedures. The new document can be found on our Publications page.
Station 46088 (LLNR 16337) - NEW DUNGENESS - 17 NM NE of Port Angeles, WA 
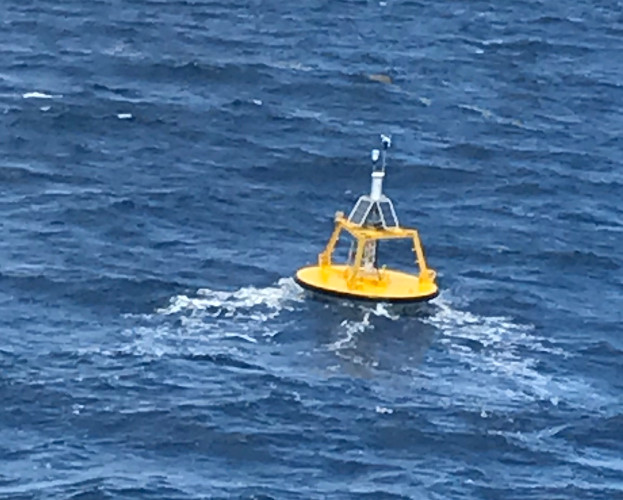
NOAA Environmental Lighted Buoy 46088
Funding provided by the United States Coast Guard
Owned and maintained by National Data Buoy Center
3-meter discus buoy
SCOOP payload
48.332 N 123.179 W (48°19'56" N 123°10'44" W)
Site elevation: sea level
Air temp height: 3.4 m above site elevation
Anemometer height: 3.8 m above site elevation
Barometer elevation: 2.4 m above mean sea level
Sea temp depth: 2 m below water line
Water depth: 115.5 m
Watch circle radius: 161 yards
(24 hours for tsunami stations)

|
Click on the graph icon in the table below to see a time series plot of the last five days of that observation. | |
| ESE ( 120 deg true ) | |
| 9.7 kts | |
| 11.7 kts | |
| 30.00 in | |
| 45.7 °F | |
| 46.6 °F | |
| 42.1 °F | |
| 40.3 °F | |
| 9.7 kts | |
| 9.7 kts | |
|
||||||||||||||||||
| TIME (PDT) |
WDIR |
WSPD kts |
GST kts |
WVHT ft |
DPD sec |
APD sec |
MWD |
PRES in |
PTDY in |
ATMP °F |
WTMP °F |
DEWP °F |
SAL psu |
VIS nmi |
TIDE ft |
|---|---|---|---|---|---|---|---|---|---|---|---|---|---|---|---|
| 2025-03-29 08:20 am | ESE | 5.8 | 9.7 | 1.3 | 3 | 3.1 | ESE | 30.00 | - | 45.9 | 46.6 | 42.1 | - | - | - |
| 2025-03-29 08:10 am | ESE | 3.9 | 5.8 | 1.3 | - | 3.1 | ESE | 30.00 | - | 45.7 | 46.6 | 42.3 | - | - | - |
| 2025-03-29 08:00 am | SE | 1.9 | 3.9 | - | - | - | - | 29.99 | +0.05 | 45.7 | 46.6 | 42.4 | - | - | - |
| 2025-03-29 07:50 am | S | 1.9 | 3.9 | 1.3 | 3 | 3.0 | E | 29.99 | - | 45.7 | 46.6 | 42.3 | - | - | - |
| 2025-03-29 07:40 am | S | 1.9 | 3.9 | - | - | - | - | 29.99 | - | 46.0 | 46.8 | 42.6 | - | - | - |
| 2025-03-29 07:30 am | SSE | 1.9 | 3.9 | - | - | - | - | 29.98 | - | 46.2 | 46.8 | 42.4 | - | - | - |
| 2025-03-29 07:20 am | SE | 3.9 | 5.8 | 1.3 | 3 | 3.1 | ESE | 29.98 | - | 46.2 | 46.8 | 42.3 | - | - | - |
| 2025-03-29 07:10 am | ESE | 5.8 | 7.8 | 1.3 | - | 3.1 | ESE | 29.98 | - | 46.0 | 46.8 | 42.4 | - | - | - |
| 2025-03-29 07:00 am | ESE | 1.9 | 3.9 | - | - | - | - | 29.98 | +0.04 | 46.0 | 46.8 | 43.0 | - | - | - |
| 2025-03-29 06:50 am | ESE | 1.9 | 1.9 | 1.3 | 3 | 3.2 | ENE | 29.97 | - | 45.9 | 46.8 | 42.8 | - | - | - |
| 2025-03-29 06:40 am | E | 3.9 | 5.8 | - | - | - | - | 29.97 | - | 45.9 | 46.8 | 42.4 | - | - | - |
| 2025-03-29 06:30 am | E | 3.9 | 5.8 | - | - | - | - | 29.96 | - | 45.5 | 46.8 | 42.3 | - | - | - |
| 2025-03-29 06:20 am | ESE | 3.9 | 5.8 | 1.0 | 3 | 3.3 | E | 29.96 | - | 45.3 | 46.8 | 42.6 | - | - | - |
| 2025-03-29 06:10 am | ESE | 3.9 | 5.8 | 1.0 | - | 3.3 | E | 29.96 | - | 45.5 | 46.8 | 43.5 | - | - | - |
| 2025-03-29 06:00 am | SE | 3.9 | 5.8 | - | - | - | - | 29.96 | +0.03 | 45.9 | 46.8 | 44.1 | - | - | - |
| 2025-03-29 05:50 am | SSE | 1.9 | 3.9 | 0.7 | - | 3.4 | - | 29.96 | - | 45.9 | 46.9 | 44.1 | - | - | - |
| 2025-03-29 05:40 am | SW | 1.9 | 3.9 | - | - | - | - | 29.96 | - | 45.7 | - | 44.2 | - | - | - |
| 2025-03-29 05:30 am | S | 3.9 | 5.8 | - | - | - | - | 29.96 | - | 45.7 | 46.9 | 44.2 | - | - | - |
| 2025-03-29 05:20 am | S | 3.9 | 5.8 | 0.7 | - | 3.5 | - | 29.95 | - | 46.2 | 46.9 | 44.8 | - | - | - |
| 2025-03-29 05:10 am | SW | 3.9 | 3.9 | - | - | - | - | 29.95 | - | 46.2 | 46.9 | 44.8 | - | - | - |
| 2025-03-29 05:00 am | WSW | 5.8 | 5.8 | - | - | - | - | 29.95 | +0.04 | 46.2 | 46.8 | 44.8 | - | - | - |
| 2025-03-29 04:50 am | SW | 3.9 | 5.8 | 0.7 | - | 3.5 | - | 29.95 | - | 46.2 | 46.6 | 44.6 | - | - | - |
| 2025-03-29 04:40 am | SSW | 5.8 | 5.8 | - | - | - | - | 29.95 | - | 46.2 | 46.6 | 44.2 | - | - | - |
| 2025-03-29 04:30 am | SSW | 3.9 | 3.9 | - | - | - | - | 29.94 | - | 46.0 | 46.6 | 43.5 | - | - | - |
| 2025-03-29 04:20 am | SSW | 3.9 | 3.9 | 0.7 | - | 3.5 | - | 29.94 | - | 46.0 | 46.6 | 43.5 | - | - | - |
| 2025-03-29 04:10 am | SW | 1.9 | 3.9 | 0.7 | - | 3.5 | - | 29.94 | - | 46.2 | 46.6 | 43.5 | - | - | - |
| 2025-03-29 04:00 am | SSW | 1.9 | 1.9 | - | - | - | - | 29.94 | +0.04 | 46.2 | 46.6 | 43.5 | - | - | - |
| 2025-03-29 03:50 am | S | 1.9 | 3.9 | 0.3 | - | 3.4 | - | 29.94 | - | 46.2 | 46.6 | 43.3 | - | - | - |
| 2025-03-29 03:40 am | SE | 1.9 | 3.9 | - | - | - | - | 29.93 | - | 46.2 | 46.6 | 43.3 | - | - | - |
| 2025-03-29 03:30 am | SE | 1.9 | 3.9 | - | - | - | - | 29.93 | - | 46.4 | 46.8 | 43.3 | - | - | - |
| 2025-03-29 03:20 am | SE | 3.9 | 5.8 | 0.3 | - | 3.0 | - | 29.93 | - | 46.4 | 46.8 | 43.2 | - | - | - |
| 2025-03-29 03:10 am | SE | 3.9 | 5.8 | 0.3 | - | 3.0 | - | 29.93 | - | 46.4 | 46.8 | 43.2 | - | - | - |
| 2025-03-29 03:00 am | SE | 3.9 | 5.8 | - | - | - | - | 29.93 | +0.05 | 46.6 | 46.8 | 43.2 | - | - | - |
| 2025-03-29 02:50 am | SE | 3.9 | 5.8 | 0.7 | - | 3.1 | - | 29.93 | - | 46.4 | 46.9 | 43.0 | - | - | - |
| 2025-03-29 02:40 am | SE | 5.8 | 5.8 | - | - | - | - | 29.93 | - | 46.6 | 46.9 | 43.5 | - | - | - |
| 2025-03-29 02:30 am | SE | 3.9 | 5.8 | - | - | - | - | 29.93 | - | 46.6 | 46.9 | 43.9 | - | - | - |
| 2025-03-29 02:20 am | SE | 3.9 | 5.8 | 0.7 | - | 3.1 | - | 29.92 | - | 46.8 | 46.9 | 44.2 | - | - | - |
| 2025-03-29 02:10 am | SSE | 5.8 | 7.8 | 0.7 | - | 3.1 | - | 29.92 | - | 46.9 | 46.9 | 44.6 | - | - | - |
| 2025-03-29 02:00 am | SSE | 5.8 | 5.8 | - | - | - | - | 29.92 | +0.05 | 46.8 | 46.9 | 44.2 | - | - | - |
| 2025-03-29 01:50 am | SSE | 3.9 | 7.8 | 0.7 | - | 2.9 | - | 29.91 | - | 46.9 | 46.9 | 44.8 | - | - | - |
| 2025-03-29 01:40 am | S | 5.8 | 5.8 | 0.7 | - | 2.9 | - | 29.91 | - | 46.9 | 46.9 | 44.6 | - | - | - |
| 2025-03-29 01:30 am | S | 3.9 | 5.8 | - | - | - | - | 29.90 | - | 46.9 | 46.9 | 44.4 | - | - | - |
| 2025-03-29 01:20 am | S | 5.8 | 5.8 | 0.7 | - | 3.2 | - | 29.90 | - | 46.9 | 46.9 | 44.6 | - | - | - |
| 2025-03-29 01:10 am | S | 3.9 | 5.8 | 0.7 | - | 3.2 | - | 29.90 | - | 46.9 | 46.8 | 44.4 | - | - | - |
| 2025-03-29 01:00 am | S | 5.8 | 5.8 | - | - | - | - | 29.90 | +0.05 | 46.9 | 46.8 | 44.4 | - | - | - |
| 2025-03-29 12:50 am | S | 5.8 | 5.8 | 0.7 | - | 3.1 | - | 29.90 | - | 46.9 | - | 44.4 | - | - | - |
| 2025-03-29 12:40 am | S | 5.8 | 7.8 | 0.7 | - | 3.1 | - | 29.89 | - | 47.1 | 46.8 | 44.6 | - | - | - |
| 2025-03-29 12:30 am | S | 5.8 | 5.8 | - | - | - | - | 29.89 | - | 47.1 | 46.8 | 44.1 | - | - | - |
| 2025-03-29 12:20 am | S | 5.8 | 5.8 | 0.7 | - | 3.3 | - | 29.89 | - | 47.3 | 46.8 | 43.7 | - | - | - |
| 2025-03-29 12:10 am | SSW | 3.9 | 5.8 | 0.7 | - | 3.3 | - | 29.89 | - | 47.1 | 46.8 | 43.2 | - | - | - |
| 2025-03-29 12:00 am | SSW | 3.9 | 3.9 | - | - | - | - | 29.88 | +0.06 | 47.1 | 46.8 | 43.2 | - | - | - |
| 2025-03-28 11:50 pm | SSW | 1.9 | 3.9 | 0.7 | - | 3.3 | - | 29.88 | - | 47.1 | 46.8 | 43.5 | - | - | - |
| 2025-03-28 11:40 pm | S | 1.9 | 5.8 | - | - | - | - | 29.88 | - | 47.5 | 46.8 | 43.9 | - | - | - |
| 2025-03-28 11:30 pm | S | 3.9 | 5.8 | - | - | - | - | 29.87 | - | 47.1 | 46.8 | 43.9 | - | - | - |
| 2025-03-28 11:20 pm | SSE | 3.9 | 7.8 | 0.7 | - | 2.9 | - | 29.87 | - | 47.1 | 46.8 | 44.1 | - | - | - |
| 2025-03-28 11:10 pm | SW | 3.9 | 3.9 | - | - | - | - | 29.87 | - | 47.3 | 46.8 | 43.9 | - | - | - |
| 2025-03-28 11:00 pm | WSW | 1.9 | 1.9 | - | - | - | - | 29.86 | +0.08 | 47.3 | 46.8 | 43.9 | - | - | - |
| 2025-03-28 10:50 pm | WSW | 1.9 | 1.9 | 0.7 | - | 2.9 | - | 29.87 | - | 47.3 | 46.8 | 44.1 | - | - | - |
| 2025-03-28 10:40 pm | - | 0.0 | 1.9 | - | - | - | - | 29.86 | - | 47.3 | 46.8 | 44.1 | - | - | - |
| 2025-03-28 10:30 pm | W | 1.9 | 3.9 | - | - | - | - | 29.86 | - | 47.5 | 46.8 | 44.1 | - | - | - |
| 2025-03-28 10:20 pm | W | 3.9 | 3.9 | 0.7 | - | 2.9 | - | 29.85 | - | 47.5 | 46.8 | 43.9 | - | - | - |
| 2025-03-28 10:10 pm | W | 1.9 | 3.9 | 0.7 | - | 2.9 | - | 29.85 | - | 47.5 | 46.8 | 43.9 | - | - | - |
| 2025-03-28 10:00 pm | W | 1.9 | 3.9 | - | - | - | - | 29.85 | +0.07 | 47.7 | 46.8 | 43.7 | - | - | - |
| 2025-03-28 09:50 pm | W | 3.9 | 5.8 | 0.7 | - | 2.8 | - | 29.84 | - | 47.7 | 46.8 | 43.5 | - | - | - |
| 2025-03-28 09:40 pm | W | 1.9 | 5.8 | 0.7 | - | 2.8 | - | 29.84 | - | 47.8 | 46.6 | 43.7 | - | - | - |
| 2025-03-28 09:30 pm | - | 0.0 | 0.0 | - | - | - | - | 29.83 | - | 48.0 | 46.6 | 43.7 | - | - | - |
| 2025-03-28 09:20 pm | - | 0.0 | 0.0 | 1.0 | 3 | 2.9 | ESE | 29.83 | - | 48.0 | 46.6 | 43.5 | - | - | - |
| 2025-03-28 09:10 pm | W | 3.9 | 7.8 | 1.0 | - | 2.9 | ESE | 29.83 | - | 48.0 | 46.6 | 43.5 | - | - | - |
| 2025-03-28 09:00 pm | W | 5.8 | 7.8 | - | - | - | - | 29.82 | +0.07 | 48.2 | 46.8 | 43.5 | - | - | - |
| 2025-03-28 08:50 pm | W | 5.8 | 7.8 | 1.0 | 4 | 3.0 | ESE | 29.82 | - | 48.0 | 46.6 | 43.7 | - | - | - |
| 2025-03-28 08:40 pm | W | 3.9 | 5.8 | 1.0 | - | 3.0 | ESE | 29.81 | - | 47.8 | 46.8 | 44.2 | - | - | - |
| 2025-03-28 08:30 pm | WSW | 3.9 | 5.8 | - | - | - | - | 29.80 | - | 47.7 | 46.8 | 44.2 | - | - | - |
| 2025-03-28 08:20 pm | SW | 3.9 | 5.8 | 1.0 | 4 | 3.0 | ESE | 29.80 | - | 47.7 | 46.8 | 44.4 | - | - | - |
| 2025-03-28 08:10 pm | SW | 1.9 | 5.8 | - | - | - | - | 29.79 | - | 47.5 | 46.8 | 44.8 | - | - | - |
| 2025-03-28 08:00 pm | SSW | 3.9 | 5.8 | - | - | - | - | 29.79 | +0.05 | 47.5 | 46.8 | 45.3 | - | - | - |
| 2025-03-28 07:50 pm | S | 3.9 | 3.9 | 1.0 | 4 | 3.2 | ESE | 29.78 | - | 47.5 | 46.8 | 45.3 | - | - | - |
| 2025-03-28 07:40 pm | S | 3.9 | 3.9 | - | - | - | - | 29.78 | - | 47.5 | 46.8 | 45.5 | - | - | - |
| 2025-03-28 07:30 pm | S | 3.9 | 5.8 | - | - | - | - | 29.78 | - | 47.5 | 46.9 | 45.7 | - | - | - |
| 2025-03-28 07:20 pm | S | 3.9 | 3.9 | 1.3 | 5 | 3.4 | SE | 29.78 | - | 47.7 | 46.9 | 45.9 | - | - | - |
| 2025-03-28 07:10 pm | SE | 3.9 | 3.9 | 1.3 | - | 3.4 | SE | 29.77 | - | 47.8 | 46.9 | 45.9 | - | - | - |
| 2025-03-28 07:00 pm | SE | 3.9 | 3.9 | - | - | - | - | 29.77 | +0.05 | 48.0 | - | 45.7 | - | - | - |
| 2025-03-28 06:50 pm | ESE | 3.9 | 3.9 | 1.3 | 3 | 3.3 | ESE | 29.77 | - | 48.0 | 46.9 | 46.0 | - | - | - |
| 2025-03-28 06:40 pm | SE | 1.9 | 3.9 | - | - | - | - | 29.76 | - | 48.2 | 47.1 | 46.4 | - | - | - |
| 2025-03-28 06:30 pm | - | 0.0 | 1.9 | - | - | - | - | 29.76 | - | 48.2 | 47.3 | 46.4 | - | - | - |
| 2025-03-28 06:20 pm | S | 3.9 | 5.8 | 1.3 | 4 | 3.4 | ESE | 29.75 | - | 48.0 | 47.1 | 46.2 | - | - | - |
| 2025-03-28 06:10 pm | SSE | 3.9 | 5.8 | 1.3 | - | 3.4 | ESE | 29.76 | - | 48.0 | 47.1 | 46.0 | - | - | - |
| 2025-03-28 06:00 pm | S | 3.9 | 3.9 | - | - | - | - | 29.75 | +0.05 | 48.4 | 47.3 | 46.2 | - | - | - |
| 2025-03-28 05:50 pm | SW | 1.9 | 3.9 | 1.3 | 3 | 3.5 | ESE | 29.75 | - | 48.4 | 47.3 | 46.4 | - | - | - |
| 2025-03-28 05:40 pm | W | 3.9 | 3.9 | - | - | - | - | 29.74 | - | 48.2 | 47.1 | 46.2 | - | - | - |
| 2025-03-28 05:30 pm | W | 1.9 | 3.9 | - | - | - | - | 29.74 | - | 48.2 | 46.9 | 46.2 | - | - | - |
| 2025-03-28 05:20 pm | SSW | 1.9 | 1.9 | 1.3 | 4 | 3.6 | E | 29.74 | - | 48.4 | 47.1 | 46.2 | - | - | - |
| 2025-03-28 05:10 pm | WSW | 1.9 | 3.9 | 1.3 | - | 3.6 | E | 29.74 | - | 48.4 | 46.9 | 46.0 | - | - | - |
| 2025-03-28 05:00 pm | W | 1.9 | 3.9 | - | - | - | - | 29.73 | +0.04 | 48.6 | 47.1 | 46.0 | - | - | - |
| 2025-03-28 04:50 pm | W | 1.9 | 5.8 | 1.3 | 4 | 3.8 | E | 29.73 | - | 48.4 | 47.1 | 45.9 | - | - | - |
| 2025-03-28 04:40 pm | W | 5.8 | 7.8 | - | - | - | - | 29.72 | - | 48.4 | 47.1 | 45.7 | - | - | - |
| 2025-03-28 04:30 pm | W | 5.8 | 7.8 | - | - | - | - | 29.72 | - | 48.4 | 47.3 | 45.3 | - | - | - |
| 2025-03-28 04:20 pm | W | 3.9 | 5.8 | 1.0 | 5 | 3.8 | ENE | 29.72 | - | 48.2 | 47.3 | 45.1 | - | - | - |
| 2025-03-28 04:10 pm | W | 3.9 | 5.8 | 1.0 | - | 3.8 | ENE | 29.72 | - | 48.4 | 47.3 | 45.5 | - | - | - |
| 2025-03-28 04:00 pm | W | 3.9 | 3.9 | - | - | - | - | 29.72 | +0.04 | 48.4 | 47.5 | 45.5 | - | - | - |
| 2025-03-28 03:50 pm | W | 3.9 | 3.9 | 1.0 | 4 | 3.7 | E | 29.72 | - | 48.2 | 47.1 | 45.5 | - | - | - |
| 2025-03-28 03:40 pm | W | 3.9 | 3.9 | 1.0 | - | 3.7 | E | 29.72 | - | 48.0 | 47.1 | 45.5 | - | - | - |
| 2025-03-28 03:30 pm | WNW | 1.9 | 3.9 | - | - | - | - | 29.71 | - | 48.0 | 47.3 | 45.1 | - | - | - |
| 2025-03-28 03:20 pm | NW | 1.9 | 3.9 | 1.0 | 4 | 3.6 | ESE | 29.71 | - | 48.0 | 47.1 | 45.1 | - | - | - |
| 2025-03-28 03:10 pm | NW | 1.9 | 1.9 | 1.0 | - | 3.6 | ESE | 29.71 | - | 48.0 | 47.5 | 45.3 | - | - | - |
| 2025-03-28 03:00 pm | NNW | 1.9 | 3.9 | - | - | - | - | 29.70 | +0.05 | 48.0 | 47.1 | 45.5 | - | - | - |
| 2025-03-28 02:50 pm | N | 1.9 | 3.9 | 1.3 | 4 | 3.6 | ESE | 29.70 | - | 48.0 | 47.3 | 45.1 | - | - | - |
| 2025-03-28 02:40 pm | WNW | 1.9 | 3.9 | 1.3 | - | 3.6 | ESE | 29.70 | - | 48.0 | 47.1 | 45.1 | - | - | - |
| 2025-03-28 02:30 pm | WNW | 3.9 | 3.9 | - | - | - | - | 29.70 | - | 47.8 | 46.9 | 45.0 | - | - | - |
| 2025-03-28 02:20 pm | NNW | 1.9 | 1.9 | 1.6 | 4 | 3.6 | ESE | 29.70 | - | 47.8 | 47.3 | 45.0 | - | - | - |
| 2025-03-28 02:10 pm | - | 0.0 | 1.9 | 1.6 | - | 3.6 | ESE | 29.70 | - | 47.8 | 47.1 | 45.1 | - | - | - |
| 2025-03-28 02:00 pm | - | 0.0 | 1.9 | - | - | - | - | 29.69 | +0.06 | 47.7 | 47.1 | 45.0 | - | - | - |
| 2025-03-28 01:50 pm | - | 0.0 | 1.9 | 1.6 | 4 | 3.6 | ESE | 29.69 | - | 47.7 | 47.1 | 45.1 | - | - | - |
| 2025-03-28 01:40 pm | - | 0.0 | 1.9 | - | - | - | - | 29.69 | - | 47.5 | 47.1 | 45.0 | - | - | - |
| 2025-03-28 01:30 pm | - | 0.0 | 1.9 | - | - | - | - | 29.69 | - | 47.7 | 46.9 | 44.8 | - | - | - |
| 2025-03-28 01:20 pm | - | 0.0 | 1.9 | 1.6 | 4 | 3.5 | ESE | 29.68 | - | 47.7 | 46.9 | 44.8 | - | - | - |
| 2025-03-28 01:10 pm | W | 1.9 | 1.9 | 1.6 | - | 3.5 | ESE | 29.68 | - | 47.7 | 46.9 | 44.8 | - | - | - |
| 2025-03-28 01:00 pm | W | 1.9 | 1.9 | - | - | - | - | 29.68 | +0.08 | 47.7 | 46.9 | 44.8 | - | - | - |
| 2025-03-28 12:50 pm | WNW | 1.9 | 1.9 | 1.6 | 4 | 3.4 | ESE | 29.67 | - | 47.7 | 46.9 | 45.0 | - | - | - |
| 2025-03-28 12:40 pm | WNW | 1.9 | 1.9 | - | - | - | - | 29.67 | - | 47.5 | 46.9 | 44.8 | - | - | - |
| 2025-03-28 12:30 pm | - | 0.0 | 1.9 | - | - | - | - | 29.67 | - | 47.7 | 46.9 | 45.0 | - | - | - |
| 2025-03-28 12:20 pm | - | 0.0 | 1.9 | 1.6 | 4 | 3.3 | ESE | 29.66 | - | 47.7 | 46.9 | 45.0 | - | - | - |
| 2025-03-28 12:10 pm | - | 0.0 | 1.9 | - | - | - | - | 29.66 | - | 47.5 | 46.9 | 44.4 | - | - | - |
| 2025-03-28 12:00 pm | - | 0.0 | 1.9 | - | - | - | - | 29.66 | +0.07 | 47.8 | 46.9 | 44.8 | - | - | - |
| 2025-03-28 11:50 am | S | 1.9 | 1.9 | 1.6 | 4 | 3.2 | ESE | 29.65 | - | 47.5 | 46.9 | 44.2 | - | - | - |
| 2025-03-28 11:40 am | SE | 1.9 | 3.9 | - | - | - | - | 29.65 | - | 47.5 | 46.9 | 44.4 | - | - | - |
| 2025-03-28 11:30 am | - | 0.0 | 1.9 | - | - | - | - | 29.65 | - | 47.5 | 46.9 | 44.4 | - | - | - |
| 2025-03-28 11:20 am | - | 0.0 | 1.9 | 2.0 | 4 | 3.3 | ESE | 29.65 | - | 47.5 | 46.9 | 44.2 | - | - | - |
| 2025-03-28 11:10 am | - | 0.0 | 1.9 | 2.0 | - | 3.3 | ESE | 29.64 | - | 47.5 | 46.9 | 44.1 | - | - | - |
| 2025-03-28 11:00 am | - | 0.0 | 1.9 | - | - | - | - | 29.64 | +0.06 | 47.3 | 46.9 | 43.9 | - | - | - |
| 2025-03-28 10:50 am | W | 1.9 | 3.9 | 2.0 | 3 | 3.3 | ESE | 29.63 | - | 47.5 | 46.9 | 44.1 | - | - | - |
| 2025-03-28 10:40 am | SSW | 3.9 | 5.8 | - | - | - | - | 29.63 | - | 47.8 | 46.9 | 44.1 | - | - | - |
| 2025-03-28 10:30 am | S | 3.9 | 5.8 | - | - | - | - | 29.62 | - | 48.0 | 46.9 | 43.7 | - | - | - |
| 2025-03-28 10:20 am | SE | 5.8 | 7.8 | 1.6 | 4 | 3.3 | SE | 29.62 | - | 47.8 | 46.9 | 43.7 | - | - | - |
| 2025-03-28 10:10 am | ESE | 5.8 | 7.8 | 1.6 | - | 3.3 | SE | 29.61 | - | 47.7 | 46.9 | 43.7 | - | - | - |
| 2025-03-28 10:00 am | E | 3.9 | 5.8 | - | - | - | - | 29.60 | +0.05 | 47.3 | 46.9 | 43.2 | - | - | - |
| 2025-03-28 09:50 am | SE | 5.8 | 5.8 | 2.0 | 4 | 3.3 | ESE | 29.61 | - | 47.3 | 46.9 | 43.7 | - | - | - |
| 2025-03-28 09:40 am | SSE | 5.8 | 5.8 | - | - | - | - | 29.60 | - | 47.5 | 46.9 | 43.7 | - | - | - |
| 2025-03-28 09:30 am | SSE | 5.8 | 7.8 | - | - | - | - | 29.60 | - | 47.7 | 46.9 | 43.7 | - | - | - |
| 2025-03-28 09:20 am | SSE | 1.9 | 3.9 | 2.0 | 4 | 3.3 | ESE | 29.59 | - | 47.7 | 46.9 | 43.3 | - | - | - |
| 2025-03-28 09:10 am | - | 0.0 | 1.9 | 2.0 | - | 3.3 | ESE | 29.59 | - | 47.5 | 46.9 | 42.8 | - | - | - |
| 2025-03-28 09:00 am | SE | 1.9 | 1.9 | - | - | - | - | 29.59 | +0.06 | 47.3 | 46.9 | 43.2 | - | - | - |
| 2025-03-28 08:50 am | SE | 1.9 | 3.9 | 2.0 | 4 | 3.3 | ESE | 29.59 | - | 47.3 | 46.9 | 43.9 | - | - | - |
| 2025-03-28 08:40 am | SE | 3.9 | 3.9 | 2.0 | - | 3.3 | ESE | 29.59 | - | 47.1 | 46.8 | 43.7 | - | - | - |
| 2025-03-28 08:30 am | SSE | 3.9 | 5.8 | - | - | - | - | 29.58 | - | 47.1 | 46.9 | 43.9 | - | - | - |
| 2025-03-28 08:20 am | SSE | 5.8 | 7.8 | 2.0 | 4 | 3.4 | ESE | 29.58 | - | 47.3 | 46.8 | 44.1 | - | - | - |
| 2025-03-28 08:10 am | SSE | 7.8 | 7.8 | 2.0 | - | 3.4 | ESE | 29.58 | - | 46.9 | 46.8 | 43.7 | - | - | - |
| 2025-03-28 08:00 am | SSE | 7.8 | 7.8 | - | - | - | - | 29.57 | +0.05 | 46.8 | 46.8 | 43.5 | - | - | - |
| 2025-03-28 07:50 am | SSE | 9.7 | 11.7 | 2.6 | 4 | 3.5 | ESE | 29.57 | - | 46.8 | 46.8 | 43.5 | - | - | - |
|
These wave data are displayed in rounded times. Click on the graph icon in the table below to see a time series plot of the last five days of that observation. | |
| 1.3 ft | |
| 0.7 ft | |
| 11.4 sec | |
| WSW | |
| 1.3 ft | |
| 3.3 sec | |
| ESE | |
| 3.1 sec | |
| TIME (PDT) |
WVHT ft |
SwH ft |
SwP sec |
SwD |
WWH ft |
WWP sec |
WWD |
STEEPNESS |
APD sec |
|---|---|---|---|---|---|---|---|---|---|
| 2025-03-29 07:40 am | 1.3 | 0.3 | 4.3 | SE | 1.3 | 3.0 | E | N/A | 3.0 |
| 2025-03-29 07:10 am | 1.3 | 0.7 | 10.8 | SSW | 1.0 | 3.3 | ESE | N/A | 3.1 |
| 2025-03-29 06:40 am | 1.3 | 0.7 | 5.6 | SE | 1.0 | 3.4 | ENE | N/A | 3.2 |
| 2025-03-29 06:10 am | 1.0 | 0.7 | 5.0 | SE | 1.0 | 3.2 | E | N/A | 3.3 |
| 2025-03-29 05:40 am | 0.7 | - | - | - | - | - | - | N/A | 3.4 |
| 2025-03-29 05:10 am | 0.7 | - | - | - | - | - | - | N/A | 3.5 |
| 2025-03-29 04:40 am | 0.7 | - | - | - | - | - | - | N/A | 3.5 |
| 2025-03-29 04:10 am | 0.7 | - | - | - | - | - | - | N/A | 3.5 |
| 2025-03-29 03:40 am | 0.3 | - | - | - | - | - | - | N/A | 3.4 |
| 2025-03-29 03:10 am | 0.3 | - | - | - | - | - | - | N/A | 3.0 |
| 2025-03-29 02:40 am | 0.7 | - | - | - | - | - | - | N/A | 3.1 |
| 2025-03-29 02:10 am | 0.7 | - | - | - | - | - | - | N/A | 3.1 |
| 2025-03-29 01:40 am | 0.7 | - | - | - | - | - | - | N/A | 2.9 |
| 2025-03-29 01:10 am | 0.7 | - | - | - | - | - | - | N/A | 3.2 |
| 2025-03-29 12:40 am | 0.7 | - | - | - | - | - | - | N/A | 3.1 |
| 2025-03-29 12:10 am | 0.7 | - | - | - | - | - | - | N/A | 3.3 |
| 2025-03-28 11:40 pm | 0.7 | - | - | - | - | - | - | N/A | 3.3 |
| 2025-03-28 11:10 pm | 0.7 | - | - | - | - | - | - | N/A | 2.9 |
| 2025-03-28 10:40 pm | 0.7 | - | - | - | - | - | - | N/A | 2.9 |
| 2025-03-28 10:10 pm | 0.7 | - | - | - | - | - | - | N/A | 2.9 |
| 2025-03-28 09:40 pm | 0.7 | - | - | - | - | - | - | N/A | 2.8 |
| 2025-03-28 09:10 pm | 1.0 | 0.3 | 10.8 | WNW | 1.0 | 3.1 | ESE | N/A | 2.9 |
| 2025-03-28 08:40 pm | 1.0 | 0.3 | 5.6 | NNW | 1.0 | 3.6 | ESE | N/A | 3.0 |
| 2025-03-28 08:10 pm | 1.0 | 0.3 | 4.2 | ESE | 1.0 | 3.8 | ESE | N/A | 3.0 |
| 2025-03-28 07:40 pm | 1.0 | 0.3 | 4.3 | ESE | 1.0 | 4.0 | ESE | N/A | 3.2 |
| 2025-03-28 07:10 pm | 1.3 | 0.7 | 4.5 | SE | 1.3 | 3.1 | ESE | N/A | 3.4 |
| 2025-03-28 06:40 pm | 1.3 | 0.7 | 4.3 | SE | 1.0 | 3.1 | ESE | N/A | 3.3 |
| 2025-03-28 06:10 pm | 1.3 | 0.7 | 5.0 | ESE | 1.0 | 3.6 | ESE | N/A | 3.4 |
| 2025-03-28 05:40 pm | 1.3 | 0.7 | 4.3 | E | 1.0 | 3.3 | ESE | N/A | 3.5 |
| 2025-03-28 05:10 pm | 1.3 | 0.7 | 5.6 | SE | 1.0 | 4.0 | E | N/A | 3.6 |
| 2025-03-28 04:40 pm | 1.3 | 1.0 | 4.2 | E | 1.0 | 3.8 | E | N/A | 3.8 |
| 2025-03-28 04:10 pm | 1.0 | 0.7 | 4.8 | ENE | 0.7 | 3.7 | E | N/A | 3.8 |
| 2025-03-28 03:40 pm | 1.0 | 0.7 | 4.3 | ENE | 1.0 | 4.0 | E | N/A | 3.7 |
| 2025-03-28 03:10 pm | 1.0 | 0.7 | 4.2 | ESE | 1.0 | 3.6 | ESE | N/A | 3.6 |
| 2025-03-28 02:40 pm | 1.3 | 0.7 | 4.5 | E | 1.0 | 4.0 | ESE | N/A | 3.6 |
| 2025-03-28 02:10 pm | 1.6 | 0.7 | 4.3 | E | 1.3 | 4.0 | ESE | N/A | 3.6 |
| 2025-03-28 01:40 pm | 1.6 | 1.0 | 4.2 | ESE | 1.3 | 3.8 | E | N/A | 3.6 |
| 2025-03-28 01:10 pm | 1.6 | 0.7 | 6.7 | SW | 1.3 | 3.7 | ESE | N/A | 3.5 |
| 2025-03-28 12:40 pm | 1.6 | 0.7 | 7.1 | SW | 1.3 | 3.8 | ESE | N/A | 3.4 |
| 2025-03-28 12:10 pm | 1.6 | 0.7 | 4.8 | ENE | 1.6 | 3.7 | ESE | N/A | 3.3 |
| 2025-03-28 11:40 am | 1.6 | 0.7 | 4.5 | E | 1.6 | 3.6 | ESE | N/A | 3.2 |
| 2025-03-28 11:10 am | 2.0 | 0.7 | 5.9 | SE | 1.6 | 3.6 | ESE | N/A | 3.3 |
| 2025-03-28 10:40 am | 2.0 | 0.7 | 8.3 | NE | 1.6 | 3.3 | ESE | N/A | 3.3 |
| 2025-03-28 10:10 am | 1.6 | 0.7 | 5.3 | WNW | 1.3 | 3.7 | SE | N/A | 3.3 |
| 2025-03-28 09:40 am | 2.0 | 0.7 | 4.2 | ESE | 1.6 | 3.7 | ESE | N/A | 3.3 |
| 2025-03-28 09:10 am | 2.0 | 0.7 | 5.6 | WNW | 1.6 | 4.0 | ESE | N/A | 3.3 |
| 2025-03-28 08:40 am | 2.0 | 1.0 | 4.2 | ESE | 1.6 | 3.6 | ESE | N/A | 3.3 |
| 2025-03-28 08:10 am | 2.0 | 1.3 | 4.3 | ESE | 1.6 | 3.6 | ESE | N/A | 3.4 |
Ocean Current Data for 46088
| 8:50 am PDT | 8:20 am PDT | 7:50 am PDT | 7:20 am PDT | 6:50 am PDT | 6:20 am PDT | 5:50 am PDT | 5:20 am PDT | |||||||||
|---|---|---|---|---|---|---|---|---|---|---|---|---|---|---|---|---|
| Depth ft | Dir ° | Speed kts |
Dir ° | Speed kts |
Dir ° | Speed kts |
Dir ° | Speed kts |
Dir ° | Speed kts |
Dir ° | Speed kts |
Dir ° | Speed kts |
Dir ° | Speed kts |
| 5 | - | - | - | - | 200 | 1.04 | - | - | - | - | - | - | - | - | - | - |
| 5 | - | - | 207 | 1.36 | - | - | - | - | - | - | - | - | - | - | - | - |
| 5 | 218 | 1.34 | - | - | - | - | - | - | - | - | - | - | - | - | - | - |
Previous 24 hours of ocean current data for 46088
Ocean Current Stick Plots are available in metric units only:
All Instruments -  1-day plot 3-day plot 5-day plot
Links which are specific to this station are listed below:
Real Time Data in tabular form for the last forty-five days.
Historical Data & Climatic Summaries for quality controlled data for prior months and years.
The weekly status report and the weekly maintenance report also provide valuable station information.
Note that the payload types and the station locations occasionally change.