


NDBC has recently revised the NDBC Handbook of Automated Data Quality Control Checks and Procedures. The new document can be found on our Publications page.
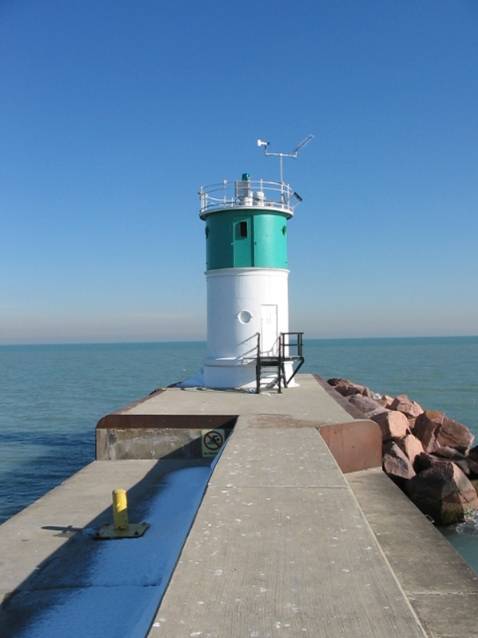
Station WHRI2 - Waukegan Harbor, IL 
Owned and maintained by National Weather Service Central Region
GLOS Weather Station
42.361 N 87.813 W (42°21'38" N 87°48'48" W)
Site elevation: 180 m above mean sea level
Air temp height: 7.9 m above site elevation
Anemometer height: 9 m above site elevation
Barometer elevation: 187.8 m above mean sea level
(24 hours for tsunami stations)
|
Click on the graph icon in the table below to see a time series plot of the last five days of that observation. | |
| ESE ( 110 deg true ) | |
| 12.0 kts | |
| 14.0 kts | |
| 38.1 °F | |
| 29.8 °F | |
| 11.7 kts | |
| 13.6 kts | |
| TIME (CDT) |
WDIR |
WSPD kts |
GST kts |
WVHT ft |
DPD sec |
APD sec |
MWD |
PRES in |
PTDY in |
ATMP °F |
WTMP °F |
DEWP °F |
SAL psu |
VIS nmi |
TIDE ft |
|---|---|---|---|---|---|---|---|---|---|---|---|---|---|---|---|
| 2025-04-09 03:50 pm | ESE | 12.0 | 14.0 | - | - | - | - | - | - | 38.3 | - | - | - | - | - |
| 2025-04-09 03:00 pm | ESE | 12.0 | 14.0 | - | - | - | - | - | - | 38.8 | - | - | - | - | - |
| 2025-04-09 02:50 pm | ESE | 12.0 | 15.0 | - | - | - | - | - | - | 39.0 | - | - | - | - | - |
| 2025-04-09 02:00 pm | ESE | 12.0 | 13.0 | - | - | - | - | - | - | 38.8 | - | - | - | - | - |
| 2025-04-09 01:50 pm | ESE | 9.9 | 12.0 | - | - | - | - | - | - | - | - | - | - | - | - |
| 2025-04-09 01:00 pm | SE | 9.9 | 13.0 | - | - | - | - | - | - | 40.1 | - | - | - | - | - |
| 2025-04-09 12:50 pm | SE | 8.9 | 12.0 | - | - | - | - | - | - | 39.7 | - | - | - | - | - |
| 2025-04-09 12:00 pm | SE | 9.9 | 12.0 | - | - | - | - | - | - | - | - | - | - | - | - |
| 2025-04-09 11:50 am | SE | 8.0 | 11.1 | - | - | - | - | - | - | - | - | - | - | - | - |
| 2025-04-09 11:00 am | SSE | 8.9 | 9.9 | - | - | - | - | - | - | - | - | - | - | - | - |
| 2025-04-09 10:50 am | SSE | 8.9 | 11.1 | - | - | - | - | - | - | - | - | - | - | - | - |
| 2025-04-09 10:00 am | SSE | 8.9 | 11.1 | - | - | - | - | - | - | 40.3 | - | - | - | - | - |
| 2025-04-09 09:50 am | SSE | 8.9 | 11.1 | - | - | - | - | - | - | - | - | - | - | - | - |
| 2025-04-09 09:00 am | SSE | 8.0 | 8.9 | - | - | - | - | - | - | 39.0 | - | - | - | - | - |
| 2025-04-09 08:50 am | SSE | 8.0 | 8.9 | - | - | - | - | - | - | 38.5 | - | - | - | - | - |
| 2025-04-09 08:00 am | SSE | 8.0 | 9.9 | - | - | - | - | - | - | 37.2 | - | - | - | - | - |
| 2025-04-09 07:50 am | SSE | 8.9 | 9.9 | - | - | - | - | - | - | 36.9 | - | - | - | - | - |
| 2025-04-09 07:00 am | SSE | 8.0 | 8.9 | - | - | - | - | - | - | 36.7 | - | - | - | - | - |
| 2025-04-09 06:50 am | SSE | 8.9 | 9.9 | - | - | - | - | - | - | 36.7 | - | - | - | - | - |
| 2025-04-09 06:00 am | SSE | 8.9 | 11.1 | - | - | - | - | - | - | 37.0 | - | - | - | - | - |
| 2025-04-09 05:50 am | SSE | 8.9 | 9.9 | - | - | - | - | - | - | 37.0 | - | - | - | - | - |
| 2025-04-09 05:00 am | SSE | 8.0 | 8.9 | - | - | - | - | - | - | 37.4 | - | - | - | - | - |
| 2025-04-09 04:50 am | SSE | 8.0 | 9.9 | - | - | - | - | - | - | 37.2 | - | - | - | - | - |
| 2025-04-09 04:00 am | SSE | 7.0 | 8.9 | - | - | - | - | - | - | 37.2 | - | - | - | - | - |
| 2025-04-09 03:50 am | SSE | 7.0 | 8.9 | - | - | - | - | - | - | 37.4 | - | - | - | - | - |
| 2025-04-09 03:00 am | SSE | 8.9 | 9.9 | - | - | - | - | - | - | 37.2 | - | - | - | - | - |
| 2025-04-09 02:50 am | SE | 8.9 | 11.1 | - | - | - | - | - | - | 37.4 | - | - | - | - | - |
| 2025-04-09 02:00 am | SE | 11.1 | 12.0 | - | - | - | - | - | - | 36.9 | - | - | - | - | - |
| 2025-04-09 01:50 am | SE | 11.1 | 12.0 | - | - | - | - | - | - | 37.0 | - | - | - | - | - |
| 2025-04-09 01:00 am | SE | 8.9 | 11.1 | - | - | - | - | - | - | 36.5 | - | - | - | - | - |
| 2025-04-09 12:50 am | SE | 8.9 | 11.1 | - | - | - | - | - | - | 36.5 | - | - | - | - | - |
| 2025-04-09 12:00 am | SE | 8.0 | 9.9 | - | - | - | - | - | - | 36.0 | - | - | - | - | - |
| 2025-04-08 11:50 pm | SE | 8.9 | 9.9 | - | - | - | - | - | - | 35.6 | - | - | - | - | - |
| 2025-04-08 11:00 pm | SE | 7.0 | - | - | - | - | - | - | - | 35.2 | - | - | - | - | - |
| 2025-04-08 10:50 pm | SE | 8.0 | 8.9 | - | - | - | - | - | - | 35.1 | - | - | - | - | - |
| 2025-04-08 10:00 pm | SE | 7.0 | 8.9 | - | - | - | - | - | - | 34.5 | - | - | - | - | - |
| 2025-04-08 09:50 pm | ESE | 7.0 | 8.0 | - | - | - | - | - | - | 34.3 | - | - | - | - | - |
| 2025-04-08 09:00 pm | ESE | 6.0 | - | - | - | - | - | - | - | 34.0 | - | - | - | - | - |
| 2025-04-08 08:50 pm | ESE | 6.0 | 7.0 | - | - | - | - | - | - | 33.8 | - | - | - | - | - |
| 2025-04-08 08:00 pm | ESE | 7.0 | 8.0 | - | - | - | - | - | - | 33.4 | - | - | - | - | - |
| 2025-04-08 07:50 pm | ESE | 7.0 | 9.9 | - | - | - | - | - | - | 33.3 | - | - | - | - | - |
| 2025-04-08 07:00 pm | ESE | 6.0 | 7.0 | - | - | - | - | - | - | 32.9 | - | - | - | - | - |
| 2025-04-08 06:50 pm | ESE | 7.0 | 8.0 | - | - | - | - | - | - | 32.9 | - | - | - | - | - |
| 2025-04-08 06:00 pm | ESE | - | - | - | - | - | - | - | - | 32.7 | - | - | - | - | - |
| 2025-04-08 05:50 pm | ESE | 5.1 | 6.0 | - | - | - | - | - | - | 32.7 | - | - | - | - | - |
| 2025-04-08 05:00 pm | E | 5.1 | 6.0 | - | - | - | - | - | - | 32.2 | - | - | - | - | - |
| 2025-04-08 04:50 pm | ESE | 5.1 | 7.0 | - | - | - | - | - | - | 32.2 | - | - | - | - | - |
Links which are specific to this station are listed below:
Real Time Data in tabular form for the last forty-five days.
Historical Data & Climatic Summaries for quality controlled data for prior months and years.