


NDBC has recently revised the NDBC Handbook of Automated Data Quality Control Checks and Procedures. The new document can be found on our Publications page.
Station 41122 - Hollywood Beach, FL (265)
Information submitted by Scripps Institution of Oceanography
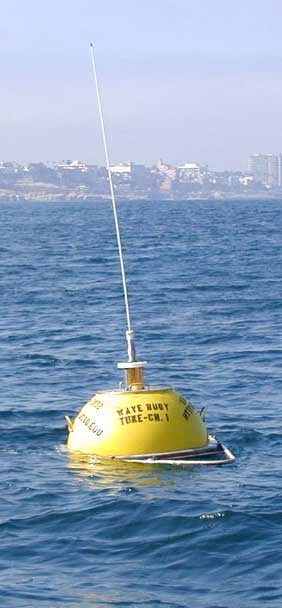
Waverider Buoy
26.001 N 80.096 W (26°0'4" N 80°5'46" W)
Site elevation: sea level
Air temp height: 2 m above site elevation
Sea temp depth: 0.46 m below water line
Water depth: 21 m
Large icon indicates selected station.
 Stations with recent data
 Stations with no data in last 8 hours
(24 hours for tsunami stations)
(24 hours for tsunami stations)
No Recent Reports
Links which are specific to this station are listed below:
Data for last 45 days: No data available.
- Historical data (data descriptions)
- Search historical meteorological data for observations that meet your threshold conditions
Some data files have been compressed with the GNU gzip program.