


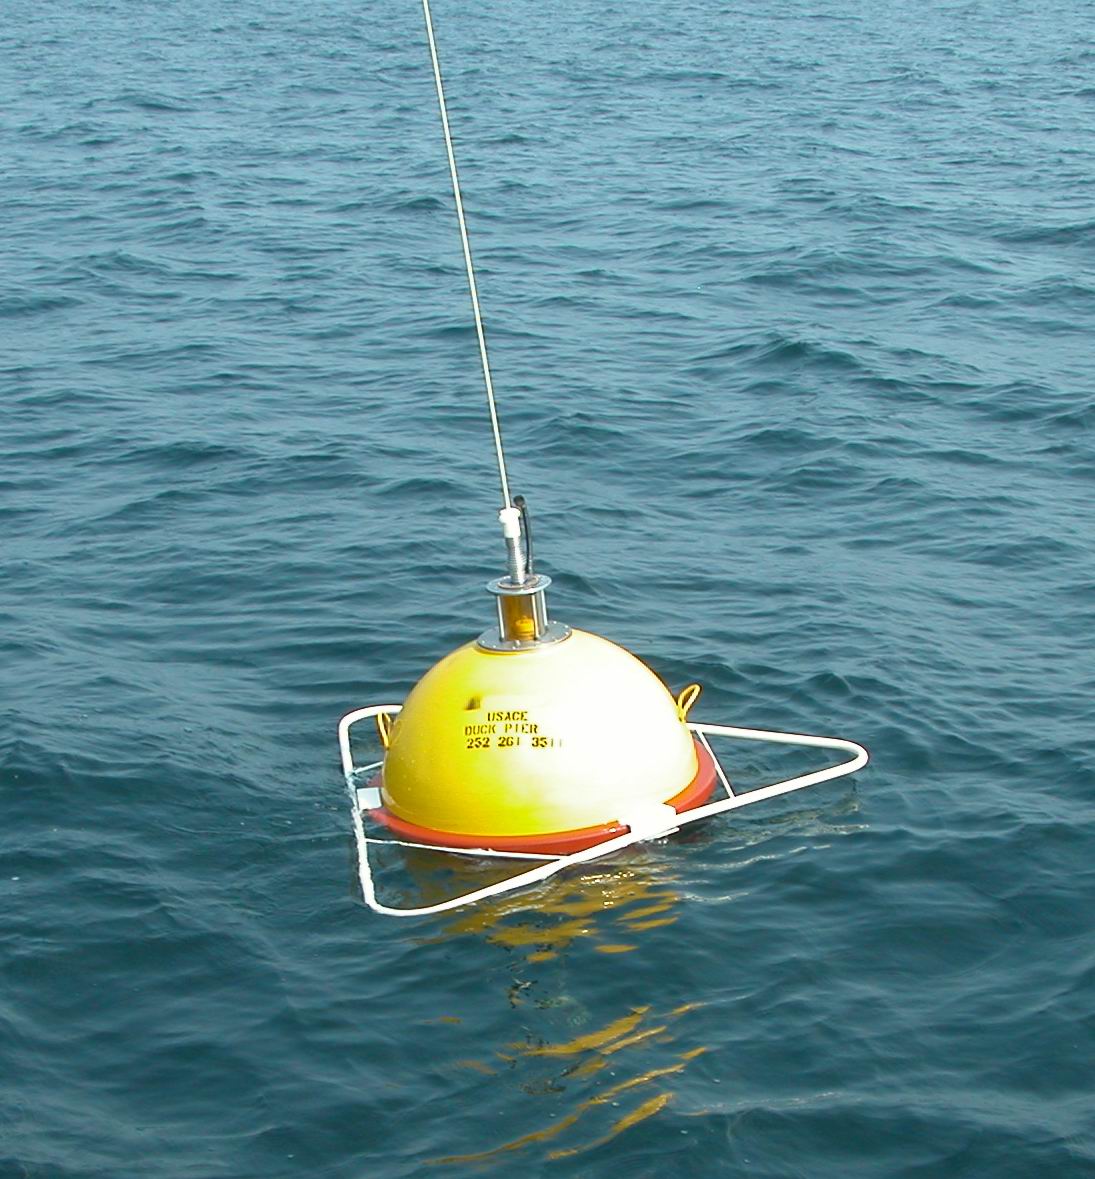
Station 44056 - Duck FRF, NC 
Owned and maintained by U.S. Army Corps of Engineers
Data provided by Scripps Institution of Oceanography
Waverider Buoy
36.200 N 75.714 W (36°11'59" N 75°42'51" W)
Site elevation: sea level
Sea temp depth: 0.46 m below water line
Water depth: 17.8 m
Right whales are active off NC from November to April. Speed restrictions of 10 knots apply to vessels 65 feet or greater in specific areas and times along the mid-Atlantic coast. To learn more about right whales and rules protecting them, go to: http://www.nmfs.noaa.gov/pr/shipstrike/?
Large icon indicates selected station.
 Stations with recent data
 Stations with no data in last 8 hours
(24 hours for tsunami stations)
(24 hours for tsunami stations)
|
Click on the graph icon in the table below to see a time series plot of the last five days of that observation. | |
| 4.3 ft | |
| 6 sec | |
| 4.3 sec | |
| NE ( 54 deg true ) | |
| 73.6 °F | |
| TIME (EDT) |
WDIR |
WSPD kts |
GST kts |
WVHT ft |
DPD sec |
APD sec |
MWD |
PRES in |
PTDY in |
ATMP °F |
WTMP °F |
DEWP °F |
SAL psu |
VIS nmi |
TIDE ft |
|---|---|---|---|---|---|---|---|---|---|---|---|---|---|---|---|
| 2024-07-27 06:26 am | - | - | - | 4.3 | 5 | 4.3 | NE | - | - | - | 73.6 | - | - | - | - |
| 2024-07-27 05:56 am | - | - | - | 4.3 | 5 | 4.3 | NE | - | - | - | 73.6 | - | - | - | - |
| 2024-07-27 05:26 am | - | - | - | 4.3 | 5 | 4.4 | NE | - | - | - | 73.8 | - | - | - | - |
| 2024-07-27 04:56 am | - | - | - | 4.3 | 5 | 4.3 | NE | - | - | - | 73.6 | - | - | - | - |
| 2024-07-27 04:26 am | - | - | - | 4.3 | 5 | 4.2 | NE | - | - | - | 73.6 | - | - | - | - |
| 2024-07-27 03:56 am | - | - | - | 4.6 | 5 | 4.4 | NE | - | - | - | 73.4 | - | - | - | - |
| 2024-07-27 03:26 am | - | - | - | 4.3 | 5 | 4.2 | NE | - | - | - | 73.6 | - | - | - | - |
| 2024-07-27 02:56 am | - | - | - | 4.6 | 5 | 4.3 | NE | - | - | - | 73.8 | - | - | - | - |
| 2024-07-27 02:26 am | - | - | - | 4.3 | 5 | 4.2 | NE | - | - | - | 73.8 | - | - | - | - |
| 2024-07-27 01:56 am | - | - | - | 4.3 | 5 | 4.2 | NE | - | - | - | 73.8 | - | - | - | - |
| 2024-07-27 01:26 am | - | - | - | 4.3 | 5 | 4.2 | NE | - | - | - | 73.9 | - | - | - | - |
| 2024-07-27 12:56 am | - | - | - | 3.9 | 5 | 4.2 | NE | - | - | - | 74.1 | - | - | - | - |
| 2024-07-27 12:26 am | - | - | - | 3.9 | 5 | 4.2 | NE | - | - | - | 74.1 | - | - | - | - |
| 2024-07-26 11:56 pm | - | - | - | 3.6 | 5 | 4.2 | NE | - | - | - | 73.9 | - | - | - | - |
| 2024-07-26 11:26 pm | - | - | - | 3.6 | 5 | 4.2 | NE | - | - | - | 74.3 | - | - | - | - |
| 2024-07-26 10:56 pm | - | - | - | 3.3 | 5 | 4.1 | NE | - | - | - | 74.5 | - | - | - | - |
| 2024-07-26 10:26 pm | - | - | - | 3.3 | 5 | 4.1 | NNE | - | - | - | 74.5 | - | - | - | - |
| 2024-07-26 09:56 pm | - | - | - | 3.3 | 5 | 4.2 | NNE | - | - | - | 74.7 | - | - | - | - |
| 2024-07-26 09:26 pm | - | - | - | 3.3 | 5 | 4.1 | NE | - | - | - | 74.7 | - | - | - | - |
| 2024-07-26 08:56 pm | - | - | - | 3.0 | 4 | 4.0 | NE | - | - | - | 75.0 | - | - | - | - |
| 2024-07-26 08:26 pm | - | - | - | 3.0 | 4 | 4.0 | NE | - | - | - | 75.2 | - | - | - | - |
| 2024-07-26 07:56 pm | - | - | - | 3.0 | 4 | 4.0 | NE | - | - | - | 75.4 | - | - | - | - |
| 2024-07-26 07:26 pm | - | - | - | 2.6 | 4 | 4.0 | NE | - | - | - | 75.6 | - | - | - | - |
| 2024-07-26 06:56 pm | - | - | - | 2.6 | 4 | 4.1 | ENE | - | - | - | 75.7 | - | - | - | - |
| 2024-07-26 06:26 pm | - | - | - | 2.3 | 4 | 3.9 | NE | - | - | - | 75.7 | - | - | - | - |
| 2024-07-26 05:56 pm | - | - | - | 2.6 | 4 | 3.9 | NE | - | - | - | 75.9 | - | - | - | - |
| 2024-07-26 05:26 pm | - | - | - | 2.6 | 4 | 4.0 | NE | - | - | - | 75.9 | - | - | - | - |
| 2024-07-26 04:56 pm | - | - | - | 2.3 | 3 | 3.8 | NE | - | - | - | 75.9 | - | - | - | - |
| 2024-07-26 04:26 pm | - | - | - | 2.3 | 3 | 3.9 | ENE | - | - | - | 75.9 | - | - | - | - |
| 2024-07-26 03:56 pm | - | - | - | 2.3 | 3 | 3.8 | NE | - | - | - | 75.9 | - | - | - | - |
| 2024-07-26 03:26 pm | - | - | - | 2.3 | 8 | 4.0 | ESE | - | - | - | 75.9 | - | - | - | - |
| 2024-07-26 02:56 pm | - | - | - | 2.0 | 13 | 4.0 | ESE | - | - | - | 76.1 | - | - | - | - |
| 2024-07-26 02:26 pm | - | - | - | 2.0 | 13 | 4.2 | E | - | - | - | 76.1 | - | - | - | - |
| 2024-07-26 01:56 pm | - | - | - | 2.0 | 13 | 4.3 | ESE | - | - | - | 76.3 | - | - | - | - |
| 2024-07-26 01:26 pm | - | - | - | 2.0 | 7 | 4.0 | ESE | - | - | - | 75.7 | - | - | - | - |
| 2024-07-26 12:56 pm | - | - | - | 2.0 | 7 | 4.5 | SE | - | - | - | 75.6 | - | - | - | - |
| 2024-07-26 12:26 pm | - | - | - | 2.0 | 13 | 4.7 | ESE | - | - | - | 75.4 | - | - | - | - |
| 2024-07-26 11:56 am | - | - | - | 2.0 | 8 | 5.2 | SE | - | - | - | 75.2 | - | - | - | - |
| 2024-07-26 11:26 am | - | - | - | 2.0 | 13 | 5.7 | ESE | - | - | - | 74.8 | - | - | - | - |
| 2024-07-26 10:56 am | - | - | - | 2.0 | 13 | 6.0 | ESE | - | - | - | 74.3 | - | - | - | - |
| 2024-07-26 10:26 am | - | - | - | 2.0 | 8 | 5.9 | SE | - | - | - | 74.3 | - | - | - | - |
| 2024-07-26 09:56 am | - | - | - | 2.0 | 13 | 6.0 | ESE | - | - | - | 74.3 | - | - | - | - |
| 2024-07-26 09:26 am | - | - | - | 1.6 | 13 | 6.1 | E | - | - | - | 74.3 | - | - | - | - |
| 2024-07-26 08:56 am | - | - | - | 1.6 | 7 | 6.0 | SE | - | - | - | 74.5 | - | - | - | - |
| 2024-07-26 08:26 am | - | - | - | 1.6 | 13 | 6.0 | ESE | - | - | - | 74.8 | - | - | - | - |
| 2024-07-26 07:56 am | - | - | - | 1.6 | 5 | 5.9 | SE | - | - | - | 75.4 | - | - | - | - |
| 2024-07-26 07:26 am | - | - | - | 1.6 | 8 | 6.2 | ESE | - | - | - | 75.7 | - | - | - | - |
| 2024-07-26 06:56 am | - | - | - | 1.6 | 8 | 6.3 | ESE | - | - | - | 76.1 | - | - | - | - |
|
These wave data are displayed in rounded times. Click on the graph icon in the table below to see a time series plot of the last five days of that observation. | |
| 4.6 ft | |
| 0.7 ft | |
| 13.3 sec | |
| ESE | |
| 4.6 ft | |
| 5.3 sec | |
| ENE | |
| VERY_STEEP | |
| 4.4 sec | |
| TIME (EDT) |
WVHT ft |
SwH ft |
SwP sec |
SwD |
WWH ft |
WWP sec |
WWD |
STEEPNESS |
APD sec |
|---|---|---|---|---|---|---|---|---|---|
| 2024-07-27 06:56 am | 4.3 | 0.7 | 12.5 | E | 4.3 | 5.6 | NE | VERY_STEEP | 4.3 |
| 2024-07-27 06:26 am | 4.3 | 0.7 | 12.5 | ENE | 4.3 | 5.0 | NE | VERY_STEEP | 4.3 |
| 2024-07-27 05:56 am | 4.3 | 0.7 | 13.3 | ESE | 4.3 | 5.3 | NE | VERY_STEEP | 4.3 |
| 2024-07-27 05:26 am | 4.3 | 0.7 | 12.5 | E | 4.3 | 4.8 | NE | VERY_STEEP | 4.4 |
| 2024-07-27 04:56 am | 4.3 | 0.7 | 13.3 | E | 4.3 | 5.0 | NE | VERY_STEEP | 4.3 |
| 2024-07-27 04:26 am | 4.3 | 0.7 | 12.5 | E | 4.3 | 4.8 | NE | VERY_STEEP | 4.2 |
| 2024-07-27 03:56 am | 4.6 | 0.7 | 13.3 | ENE | 4.6 | 5.0 | NE | VERY_STEEP | 4.4 |
| 2024-07-27 03:26 am | 4.3 | 0.7 | 12.5 | E | 4.3 | 5.0 | NE | VERY_STEEP | 4.2 |
| 2024-07-27 02:56 am | 4.6 | 0.7 | 13.3 | E | 4.6 | 5.3 | NE | VERY_STEEP | 4.3 |
| 2024-07-27 02:26 am | 4.3 | 0.7 | 14.3 | E | 4.3 | 4.8 | NE | VERY_STEEP | 4.2 |
| 2024-07-27 01:56 am | 4.3 | 0.7 | 12.5 | E | 3.9 | 5.3 | NE | VERY_STEEP | 4.2 |
| 2024-07-27 01:26 am | 4.3 | 0.7 | 12.5 | ESE | 3.9 | 5.0 | NE | VERY_STEEP | 4.2 |
| 2024-07-27 12:56 am | 3.9 | 0.7 | 12.5 | ESE | 3.6 | 5.0 | NE | VERY_STEEP | 4.2 |
| 2024-07-27 12:26 am | 3.9 | 0.7 | 13.3 | E | 3.9 | 4.5 | NE | VERY_STEEP | 4.2 |
| 2024-07-26 11:56 pm | 3.6 | 0.7 | 12.5 | ESE | 3.6 | 5.3 | NE | VERY_STEEP | 4.2 |
| 2024-07-26 11:26 pm | 3.6 | 0.7 | 13.3 | E | 3.6 | 4.8 | NE | VERY_STEEP | 4.2 |
| 2024-07-26 10:56 pm | 3.3 | 0.7 | 12.5 | E | 3.3 | 5.0 | NE | VERY_STEEP | 4.1 |
| 2024-07-26 10:26 pm | 3.3 | 0.7 | 12.5 | ESE | 3.3 | 4.8 | NNE | VERY_STEEP | 4.1 |
| 2024-07-26 09:56 pm | 3.3 | 0.7 | 12.5 | E | 3.3 | 4.5 | NNE | VERY_STEEP | 4.2 |
| 2024-07-26 09:26 pm | 3.3 | 0.7 | 12.5 | E | 3.3 | 4.8 | NE | VERY_STEEP | 4.1 |
| 2024-07-26 08:56 pm | 3.0 | 0.7 | 12.5 | ESE | 3.0 | 4.0 | NE | VERY_STEEP | 4.0 |
| 2024-07-26 08:26 pm | 3.0 | 0.7 | 13.3 | E | 2.6 | 4.2 | NE | VERY_STEEP | 4.0 |
| 2024-07-26 07:56 pm | 2.6 | 0.7 | 13.3 | E | 2.6 | 3.9 | NE | VERY_STEEP | 4.0 |
| 2024-07-26 07:26 pm | 2.6 | 0.7 | 11.8 | E | 2.6 | 4.0 | NE | VERY_STEEP | 4.0 |
| 2024-07-26 06:56 pm | 2.6 | 0.7 | 12.5 | E | 2.3 | 4.0 | ENE | N/A | 4.1 |
| 2024-07-26 06:26 pm | 2.3 | 0.7 | 13.3 | E | 2.3 | 3.7 | NE | N/A | 3.9 |
| 2024-07-26 05:56 pm | 2.6 | 0.7 | 13.3 | E | 2.3 | 3.9 | NE | N/A | 3.9 |
| 2024-07-26 05:26 pm | 2.6 | 0.7 | 12.5 | ESE | 2.3 | 3.7 | NE | N/A | 4.0 |
| 2024-07-26 04:56 pm | 2.3 | 0.7 | 12.5 | E | 2.3 | 3.5 | NE | N/A | 3.8 |
| 2024-07-26 04:26 pm | 2.3 | 0.7 | 12.5 | E | 2.3 | 3.5 | ENE | N/A | 3.9 |
| 2024-07-26 03:56 pm | 2.3 | 0.7 | 13.3 | E | 2.3 | 3.5 | NE | N/A | 3.8 |
| 2024-07-26 03:26 pm | 2.3 | 0.7 | 12.5 | E | 2.0 | 7.7 | ESE | N/A | 4.0 |
| 2024-07-26 02:56 pm | 2.0 | 0.7 | 13.3 | ESE | 2.0 | 7.1 | SE | N/A | 4.0 |
| 2024-07-26 02:26 pm | 2.0 | 0.7 | 13.3 | E | 1.6 | 2.9 | ENE | N/A | 4.2 |
| 2024-07-26 01:56 pm | 2.0 | 0.7 | 13.3 | ESE | 2.0 | 6.7 | ESE | N/A | 4.3 |
| 2024-07-26 01:26 pm | 2.0 | 0.7 | 13.3 | ESE | 2.0 | 6.7 | ESE | N/A | 4.0 |
| 2024-07-26 12:56 pm | 2.0 | 0.7 | 12.5 | ESE | 2.0 | 7.1 | SE | N/A | 4.5 |
| 2024-07-26 12:26 pm | 2.0 | 0.7 | 13.3 | ESE | 2.0 | 7.1 | SE | N/A | 4.7 |
| 2024-07-26 11:56 am | 2.0 | 0.7 | 13.3 | ESE | 1.6 | 7.7 | SE | N/A | 5.2 |
| 2024-07-26 11:26 am | 2.0 | 0.7 | 12.5 | ESE | 1.6 | 7.1 | SE | N/A | 5.7 |
| 2024-07-26 10:56 am | 2.0 | 1.0 | 12.5 | ESE | 1.6 | 7.1 | SE | N/A | 6.0 |
| 2024-07-26 10:26 am | 2.0 | 0.7 | 13.3 | ESE | 1.6 | 7.7 | SE | N/A | 5.9 |
| 2024-07-26 09:56 am | 2.0 | 0.7 | 13.3 | ESE | 1.6 | 7.7 | SE | N/A | 6.0 |
| 2024-07-26 09:26 am | 1.6 | 0.7 | 13.3 | E | 1.6 | 7.7 | SE | N/A | 6.1 |
| 2024-07-26 08:56 am | 1.6 | 0.7 | 12.5 | ESE | 1.6 | 7.1 | SE | N/A | 6.0 |
| 2024-07-26 08:26 am | 1.6 | 0.7 | 13.3 | ESE | 1.6 | 8.3 | ESE | N/A | 6.0 |
| 2024-07-26 07:56 am | 1.6 | 0.7 | 13.3 | E | 1.6 | 5.3 | SE | N/A | 5.9 |
| 2024-07-26 07:26 am | 1.6 | 0.7 | 13.3 | E | 1.6 | 7.7 | ESE | N/A | 6.2 |
| 2024-07-26 06:56 am | 1.6 | 0.7 | 13.3 | E | 1.6 | 7.7 | ESE | N/A | 6.3 |
Links which are specific to this station are listed below:
Real Time Data in tabular form for the last forty-five days.
Historical Data & Climatic Summaries for quality controlled data for prior months and years.