NDBC has recently revised the NDBC Handbook of Automated Data Quality Control Checks and Procedures. The new document can be found on our Publications page.

Station 44100 - Duck FRF 26m, NC (430)
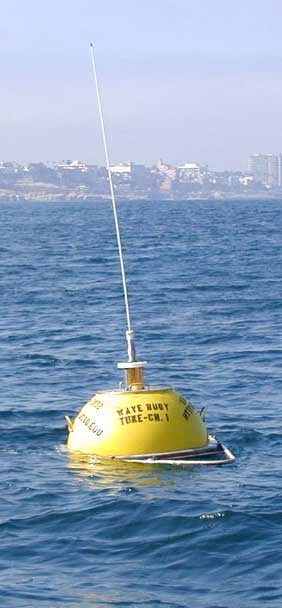
 Image indicating link to RSS feed of recent meteorological observations for station 44100


Conditions at 44100 as of
(4:30 am EDT)
0830 GMT on 03/29/2025:
     

Click on the graph icon in the table below to see a time series plot of the last five days of that observation.

5-day plot - Wave Height Wave Height (WVHT): 2.6 ft
5-day plot - Dominant Wave Period Dominant Wave Period (DPD): 5 sec
5-day plot - Average Wave Period Average Period (APD): 3.6 sec
5-day plot - Mean Wave Direction Mean Wave Direction (MWD):SSE ( 150 deg true )
5-day plot - Air Temperature Air Temperature (ATMP): 58.1 °F
5-day plot - Water Temperature Water Temperature (WTMP): 52.9 °F
Previous observations
TIME
(EDT)
5-day plot - Wind Direction
WDIR
 
5-day plot - Wind Speed
WSPD
kts
5-day plot - Wind Gust
GST
kts
5-day plot - Wave Height
WVHT
ft
5-day plot - Dominant Wave Period
DPD
sec
5-day plot - Average Wave Period
APD
sec
5-day plot - Mean Wave Direction
MWD
 
5-day plot - Atmospheric Pressure
PRES
in
5-day plot - Pressure Tendency
PTDY
in
5-day plot - Air Temperature
ATMP
°F
5-day plot - Water Temperature
WTMP
°F
5-day plot - Dew Point
DEWP
°F
5-day plot - Salinity
SAL
psu
5-day plot - Visibility
VIS
nmi
5-day plot - Tide (above MLLW)
TIDE
ft
2025-03-29 04:00 am--- 2.6 43.5SSE-- 58.3 52.9----
2025-03-29 03:30 am--- 2.6 43.6SSE-- 58.5 52.9----
2025-03-29 03:00 am--- 3.0 53.4SSE-- 58.8 53.1----
2025-03-29 02:30 am--- 2.6 43.4 SE-- 58.3 53.1----
2025-03-29 02:00 am--- 2.6 63.4SSE-- 58.8 53.1----
2025-03-29 01:30 am--- 2.6 43.3SSE-- 58.6 53.1----
2025-03-29 01:00 am--- 2.6 43.4SSE-- 59.0 53.1----
2025-03-29 12:30 am--- 2.6 43.2SSE-- 59.5 53.1----
2025-03-29 12:00 am--- 2.6 43.2SSE-- 59.4 53.1----
2025-03-28 11:30 pm--- 2.6 43.3SSE-- 59.2 53.1----
2025-03-28 11:00 pm--- 2.6 43.4SSE-- 59.2 52.9----
2025-03-28 10:30 pm--- 2.6 43.4SSE-- 59.0 52.7----
2025-03-28 10:00 pm--- 2.6 43.4SSE-- 58.8 52.7----
2025-03-28 09:30 pm--- 2.6 43.4SSE-- 58.3 52.2----
2025-03-28 09:00 pm--- 2.6 53.4SSE-- 58.1 52.5----
2025-03-28 08:30 pm--- 2.6 53.3SSE-- 58.3 52.3----
2025-03-28 08:00 pm--- 3.0 43.4SSE-- 58.8 52.3----
2025-03-28 07:30 pm--- 3.0 43.4SSE-- 58.5 52.3----
2025-03-28 07:00 pm--- 2.6 43.2SSE-- 59.0 52.3----
2025-03-28 06:30 pm--- 2.6 43.2SSE-- 58.5 52.3----
2025-03-28 06:00 pm--- 2.3 43.2SSE-- 60.3 52.5----
2025-03-28 05:30 pm--- 2.3 43.2SSE-- 58.6 52.5----
2025-03-28 05:00 pm--- 2.0 43.2SSE-- 59.5 52.5----
2025-03-28 04:30 pm--- 2.0 43.2SSE-- 57.9 52.5----
2025-03-28 04:00 pm--- 2.0 43.3SSE-- 58.3 52.5----
2025-03-28 03:30 pm--- 2.0 43.2SSE-- 57.9 52.3----
2025-03-28 03:00 pm--- 2.0 33.0 S-- 59.5 52.2----
2025-03-28 02:30 pm--- 2.0 33.1 S-- 60.1 52.0----
2025-03-28 02:00 pm--- 1.6 83.1 SE-- 59.5 52.0----
2025-03-28 01:30 pm--- 1.6 133.0 E-- 59.9 51.8----
2025-03-28 01:00 pm--- 1.6 83.1 SE-- 59.7 51.8----
2025-03-28 12:30 pm--- 1.3 133.7ESE-- 58.5 52.0----
2025-03-28 12:00 pm--- 1.3 133.2ESE-- 56.5 51.6----
2025-03-28 11:30 am--- 1.6 133.3ESE-- 55.4 51.6----
2025-03-28 11:00 am--- 1.3 133.4ESE-- 55.8 51.3----
2025-03-28 10:30 am--- 1.3 133.2 SE-- 54.7 51.3----
2025-03-28 10:00 am--- 1.3 133.1ESE-- 55.2 51.1----
2025-03-28 09:30 am--- 1.3 133.3 E-- 54.7 51.1----
2025-03-28 09:00 am--- 1.3 133.4ESE-- 54.3 51.1----
2025-03-28 08:30 am--- 1.3 133.4ESE-- 53.6 50.9----
2025-03-28 08:00 am--- 1.3 133.2ESE-- 53.4 50.9----
2025-03-28 07:30 am--- 1.6 133.3ESE-- 53.1 50.9----
2025-03-28 07:00 am--- 1.3 133.3 SE-- 52.9 50.9----
2025-03-28 06:30 am--- 1.3 133.5ESE-- 52.7 50.9----
2025-03-28 06:00 am--- 1.6 93.6ESE-- 52.7 50.9----
2025-03-28 05:30 am--- 1.6 133.7ESE-- 52.3 50.9----
2025-03-28 05:00 am--- 1.6 63.5ENE-- 52.7 51.1----

Detailed Wave Summary
for 44100 as of (4:30 am EDT)
0830 GMT on 03/29/2025:

These wave data are displayed in rounded times.


Click on the graph icon in the table below to see a time series plot of the last five days of that observation.

5-day plot - Significant Wave Height Significant Wave Height (WVHT): 2.6 ft
5-day plot - Swell Height Swell Height (SwH): 0.3 ft
5-day plot - Swell Period Swell Period (SwP): 12.5 sec
5-day plot - Swell Direction Swell Direction (SwD): E
5-day plot - Wind Wave Height Wind Wave Height (WWH): 2.6 ft
5-day plot - Wind Wave Period Wind Wave Period (WWP): 5.3 sec
5-day plot - Wind Wave Direction Wind Wave Direction (WWD):SSE
5-day plot - Wave Steepness Wave Steepness (STEEPNESS): STEEP
5-day plot - Average Wave Period Average Wave Period (APD): 3.6 sec
Previous observations
TIME
(EDT)
5-day plot - Wave Height
WVHT
ft
5-day plot - Swell Height
SwH
ft
5-day plot - Swell Period
SwP
sec
5-day plot - Swell Direction
SwD
 
5-day plot - Wind Wave Height
WWH
ft
5-day plot - Wind Wave Period
WWP
sec
5-day plot - Wind Wave Direction
WWD
 
5-day plot - Wave Steepness
STEEPNESS
 
5-day plot - Average Wave Period
APD
sec
2025-03-29 04:00 am 2.6 0.3 12.5ESE 2.6 3.5 SSEVERY_STEEP 3.5
2025-03-29 03:30 am 2.6 0.3 12.5ESE 2.6 4.1 SSEVERY_STEEP 3.6
2025-03-29 03:00 am 3.0 0.3 12.5SSE 2.6 5.3 SSE STEEP 3.4
2025-03-29 02:30 am 2.6 0.3 12.5ESE 2.6 4.3 SEVERY_STEEP 3.4
2025-03-29 02:00 am 2.6 0.3 11.8ESE 2.6 5.7 SSE N/A 3.4
2025-03-29 01:30 am 2.6 0.3 11.8ESE 2.3 3.7 SSE N/A 3.3
2025-03-29 01:00 am 2.6 0.3 12.5 SE 2.6 4.3 SSEVERY_STEEP 3.4
2025-03-29 12:30 am 2.6 0.3 12.5ESE 2.6 3.9 SSEVERY_STEEP 3.2
2025-03-29 12:00 am 2.6 0.3 12.5 SE 2.6 4.0 SSEVERY_STEEP 3.2
2025-03-28 11:30 pm 2.6 0.7 12.5ESE 2.6 4.3 SSEVERY_STEEP 3.3
2025-03-28 11:00 pm 2.6 0.3 12.5ESE 2.6 4.4 SSEVERY_STEEP 3.4
2025-03-28 10:30 pm 2.6 0.3 12.5 SE 2.6 4.3 SSE N/A 3.4
2025-03-28 10:00 pm 2.6 0.3 12.5ESE 2.6 4.3 SSE N/A 3.4
2025-03-28 09:30 pm 2.6 0.7 12.5ESE 2.3 4.7 SSE N/A 3.4
2025-03-28 09:00 pm 2.6 0.3 12.5 E 2.6 4.8 SSE N/A 3.4
2025-03-28 08:30 pm 2.6 0.3 12.5 SE 2.6 4.5 SSEVERY_STEEP 3.3
2025-03-28 08:00 pm 3.0 0.7 12.5ESE 3.0 4.3 SSEVERY_STEEP 3.4
2025-03-28 07:30 pm 3.0 0.3 12.5ESE 3.0 4.2 SSEVERY_STEEP 3.4
2025-03-28 07:00 pm 2.6 0.3 12.5ESE 2.6 4.3 SSE N/A 3.2
2025-03-28 06:30 pm 2.6 0.3 12.5 SE 2.6 4.2 SSE N/A 3.2
2025-03-28 06:00 pm 2.3 0.3 12.5 E 2.3 4.1 SSE N/A 3.2
2025-03-28 05:30 pm 2.3 0.3 11.8ESE 2.3 3.9 SSE N/A 3.2
2025-03-28 05:00 pm 2.0 0.3 12.5ESE 2.0 3.9 SSE N/A 3.2
2025-03-28 04:30 pm 2.0 0.7 11.8ESE 2.0 3.9 SSE N/A 3.2
2025-03-28 04:00 pm 2.0 0.3 12.5ESE 2.0 3.7 SSE N/A 3.3
2025-03-28 03:30 pm 2.0 0.3 12.5ESE 2.0 3.7 SSE N/A 3.2
2025-03-28 03:00 pm 2.0 0.3 12.5ESE 2.0 3.5 SSE N/A 3.0
2025-03-28 02:30 pm 2.0 0.7 12.5 SE 2.0 2.8 S N/A 3.1
2025-03-28 02:00 pm 1.6 0.7 12.5ESE 1.6 8.3 SE N/A 3.1
2025-03-28 01:30 pm 1.6 0.3 12.5 E 1.6 2.6 S N/A 3.0
2025-03-28 01:00 pm 1.6 0.3 12.5ESE 1.3 7.7 SE N/A 3.1
2025-03-28 12:30 pm 1.3 0.7 12.5ESE 1.3 8.7 SE N/A 3.7
2025-03-28 12:00 pm 1.3 0.7 12.5ESE 1.3 8.7 ESE N/A 3.2
2025-03-28 11:30 am 1.6 0.7 12.5ESE 1.3 8.7 SE N/A 3.3
2025-03-28 11:00 am 1.3 0.7 12.5ESE 1.3 8.7 SE N/A 3.4
2025-03-28 10:30 am 1.3 0.7 12.5 SE 1.3 8.3 ESE N/A 3.2
2025-03-28 10:00 am 1.3 0.3 12.5ESE 1.3 7.1 ESE N/A 3.1
2025-03-28 09:30 am 1.3 0.7 12.5 E 1.3 7.1 ESE N/A 3.3
2025-03-28 09:00 am 1.3 0.7 12.5ESE 1.3 9.5 ESE N/A 3.4
2025-03-28 08:30 am 1.3 0.7 12.5ESE 1.3 6.7 ESE N/A 3.4
2025-03-28 08:00 am 1.3 0.7 12.5ESE 1.3 7.4 ESE N/A 3.2
2025-03-28 07:30 am 1.6 0.7 12.5ESE 1.3 7.7 SE N/A 3.3
2025-03-28 07:00 am 1.3 0.7 12.5 SE 1.3 5.4 NE N/A 3.3
2025-03-28 06:30 am 1.3 0.7 12.5ESE 1.3 6.2 E N/A 3.5
2025-03-28 06:00 am 1.6 0.7 12.5ESE 1.3 8.7 ESE N/A 3.6
2025-03-28 05:30 am 1.6 0.7 12.5ESE 1.3 9.1 ESE N/A 3.7
2025-03-28 05:00 am 1.6 0.7 12.5ESE 1.3 6.5 ENE N/A 3.5

Plot of wave energy versus frequency (and period)


Disclaimer: Ocean current directions are reported to the nearest 10 degrees and speeds are measured to the nearest whole centimeter per second.

Ocean Current Data for 44100

Unit of Measure:   Time Zone:   
4:30 am EDT 4:00 am EDT 3:30 am EDT 3:00 am EDT 2:30 am EDT 2:00 am EDT 1:30 am EDT
Depth
ft
Dir
°
Speed
kts
Dir
°
Speed
kts
Dir
°
Speed
kts
Dir
°
Speed
kts
Dir
°
Speed
kts
Dir
°
Speed
kts
Dir
°
Speed
kts
3 90 0.39 80 0.43 80 0.43 80 0.51 90 0.66 90 0.66 90 0.68

Previous (up to 48) reports of ocean current data for 44100

Ocean Current Stick Plots are available in metric units only:

All Instruments - 1-day plot - ocean current 1-day plot     3-day plot - ocean current 3-day plot     5-day plot - ocean current 5-day plot