


Station 46083 (LLNR 1082) - FAIRWEATHER GROUND - 105 NM West of Juneau, AK 
Owned and maintained by National Data Buoy Center
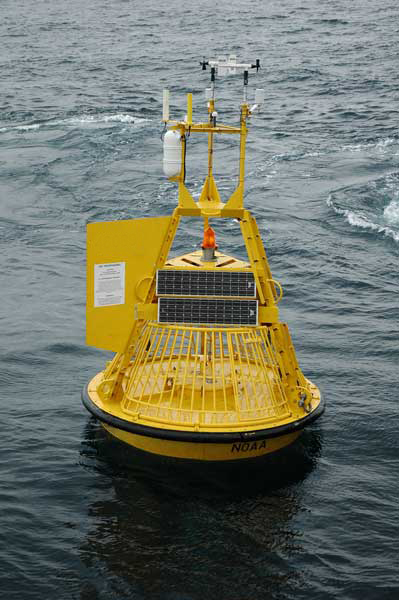
3-meter discus buoy w/ seal cage
ARES payload
58.270 N 138.019 W (58°16'12" N 138°1'8" W)
Site elevation: sea level
Air temp height: 4.4 m above site elevation
Anemometer height: 4.9 m above site elevation
Barometer elevation: 0.3 m above mean sea level
Sea temp depth: 0.6 m below water line
Water depth: 128.9 m
Watch circle radius: 191 yards
(24 hours for tsunami stations)
|
Click on the graph icon in the table below to see a time series plot of the last five days of that observation. | |
| 3.9 kts | |
| 5.8 kts | |
| 3.9 ft | |
| 8 sec | |
| 5.8 sec | |
| SW ( 220 deg true ) | |
| 29.93 in | |
| +0.02 in ( Rising ) | |
| 53.8 °F | |
| 54.1 °F | |
| 53.8 °F | |
| 3.9 kts | |
| 3.9 kts | |
|
|
| TIME (AKDT) |
WDIR |
WSPD kts |
GST kts |
WVHT ft |
DPD sec |
APD sec |
MWD |
PRES in |
PTDY in |
ATMP °F |
WTMP °F |
DEWP °F |
SAL psu |
VIS nmi |
TIDE ft |
|---|---|---|---|---|---|---|---|---|---|---|---|---|---|---|---|
| 2024-07-15 04:50 pm | - | 3.9 | 3.9 | 4.3 | 8 | 6.0 | SW | 29.92 | +0.02 | 54.1 | 54.1 | 54.1 | - | - | - |
| 2024-07-15 03:50 pm | - | 3.9 | 5.8 | 4.3 | 8 | 5.8 | SW | 29.92 | +0.02 | 54.3 | 54.3 | 54.3 | - | - | - |
| 2024-07-15 02:50 pm | - | 3.9 | 3.9 | 4.3 | 8 | 5.7 | SW | 29.91 | +0.01 | 55.0 | 55.0 | 55.0 | - | - | - |
| 2024-07-15 01:50 pm | - | 0.0 | 1.9 | 4.9 | 8 | 5.8 | SSW | 29.90 | +0.01 | 56.7 | 53.6 | 56.7 | - | - | - |
| 2024-07-15 12:50 pm | - | 1.9 | 3.9 | 4.3 | 9 | 5.7 | WSW | 29.90 | +0.01 | 53.8 | 53.2 | 53.8 | - | - | - |
| 2024-07-15 11:50 am | - | 1.9 | 3.9 | 4.9 | 8 | 5.8 | WSW | 29.89 | +0.00 | 53.4 | 53.1 | 53.4 | - | - | - |
| 2024-07-15 10:50 am | - | 1.9 | 3.9 | 5.9 | 8 | 6.1 | SW | 29.89 | +0.00 | 53.4 | 52.9 | 53.4 | - | - | - |
| 2024-07-15 09:50 am | - | 5.8 | 5.8 | 5.9 | 8 | 6.3 | WSW | 29.88 | +0.00 | 53.2 | 52.9 | 53.2 | - | - | - |
| 2024-07-15 08:50 am | - | 5.8 | 5.8 | 5.6 | 8 | 6.0 | WSW | 29.88 | +0.00 | 53.4 | 52.9 | 53.4 | - | - | - |
| 2024-07-15 07:50 am | - | 7.8 | 7.8 | 5.6 | 8 | 6.0 | WSW | 29.88 | -0.01 | 53.4 | 52.9 | 53.4 | - | - | - |
| 2024-07-15 06:50 am | - | 5.8 | 7.8 | 5.2 | 8 | 5.8 | SW | 29.89 | -0.01 | 53.2 | 52.7 | 53.2 | - | - | - |
| 2024-07-15 05:50 am | - | 7.8 | 7.8 | 5.6 | 8 | 5.9 | SW | 29.89 | +0.00 | 53.2 | 52.7 | 53.2 | - | - | - |
| 2024-07-15 04:50 am | - | 7.8 | 9.7 | 5.6 | 8 | 5.8 | SW | 29.89 | +0.00 | 53.2 | 52.5 | 53.2 | - | - | - |
| 2024-07-15 03:50 am | - | 9.7 | 11.7 | 5.6 | 8 | 5.8 | SW | 29.90 | +0.00 | 53.2 | 52.3 | 53.2 | - | - | - |
| 2024-07-15 02:50 am | - | 7.8 | 9.7 | 5.6 | 8 | 5.9 | SW | 29.89 | -0.01 | 53.2 | 52.3 | 53.2 | - | - | - |
| 2024-07-15 01:50 am | - | 9.7 | 11.7 | 6.2 | 8 | 6.0 | WSW | 29.90 | +0.00 | 53.2 | 52.3 | 53.2 | - | - | - |
| 2024-07-15 12:50 am | - | 11.7 | 13.6 | 6.2 | 8 | 5.9 | SW | 29.90 | +0.00 | 53.2 | 52.3 | 53.2 | - | - | - |
| 2024-07-14 11:50 pm | - | 11.7 | 13.6 | 7.2 | 9 | 6.4 | SW | 29.90 | +0.01 | 53.4 | 52.3 | 53.4 | - | - | - |
| 2024-07-14 10:50 pm | - | 11.7 | 13.6 | 7.2 | 8 | 6.2 | SW | 29.90 | +0.00 | 53.4 | 52.3 | 53.4 | - | - | - |
| 2024-07-14 09:50 pm | - | 11.7 | 13.6 | 7.2 | 9 | 6.4 | WSW | 29.90 | +0.00 | 53.4 | 52.3 | 53.4 | - | - | - |
| 2024-07-14 08:50 pm | - | 11.7 | 13.6 | 6.6 | 9 | 6.1 | SW | 29.89 | -0.01 | 53.4 | 52.3 | 53.4 | - | - | - |
| 2024-07-14 07:50 pm | - | 11.7 | 13.6 | 7.2 | 8 | 6.1 | WSW | 29.90 | -0.01 | 53.4 | 52.3 | 53.4 | - | - | - |
| 2024-07-14 06:50 pm | - | 13.6 | 15.5 | 7.5 | 8 | 6.1 | SW | 29.90 | +0.00 | 53.6 | 52.3 | 53.6 | - | - | - |
| 2024-07-14 05:50 pm | - | 13.6 | 15.5 | 8.2 | 8 | 6.1 | SW | 29.90 | +0.00 | 53.6 | 52.3 | 53.6 | - | - | - |
|
These wave data are displayed in rounded times. Click on the graph icon in the table below to see a time series plot of the last five days of that observation. | |
| 3.9 ft | |
| 3.9 ft | |
| 7.7 sec | |
| SW | |
| 1.3 ft | |
| 3.4 sec | |
| ESE | |
| AVERAGE | |
| 5.8 sec | |
| TIME (AKDT) |
WVHT ft |
SwH ft |
SwP sec |
SwD |
WWH ft |
WWP sec |
WWD |
STEEPNESS |
APD sec |
|---|---|---|---|---|---|---|---|---|---|
| 2024-07-15 05:00 pm | 4.3 | 3.9 | 8.3 | SW | 1.3 | 3.3 | SE | AVERAGE | 6.0 |
| 2024-07-15 04:00 pm | 4.3 | 3.9 | 8.3 | SW | 1.3 | 3.6 | SE | AVERAGE | 5.8 |
| 2024-07-15 03:00 pm | 4.3 | 4.3 | 8.3 | SW | 1.6 | 3.7 | SSE | AVERAGE | 5.7 |
| 2024-07-15 02:00 pm | 4.9 | 4.6 | 8.3 | SSW | 1.3 | 4.0 | S | AVERAGE | 5.8 |
| 2024-07-15 01:00 pm | 4.3 | 4.3 | 9.1 | WSW | 1.6 | 4.0 | SW | SWELL | 5.7 |
| 2024-07-15 12:00 pm | 4.9 | 4.9 | 8.3 | WSW | 1.6 | 3.8 | SW | AVERAGE | 5.8 |
| 2024-07-15 11:00 am | 5.9 | 5.6 | 8.3 | SW | 1.6 | 3.8 | SSE | AVERAGE | 6.1 |
| 2024-07-15 10:00 am | 5.9 | 5.9 | 7.7 | WSW | 1.3 | 3.3 | S | STEEP | 6.3 |
| 2024-07-15 09:00 am | 5.6 | 5.2 | 8.3 | WSW | 1.6 | 3.4 | SSE | AVERAGE | 6.0 |
| 2024-07-15 08:00 am | 5.6 | 5.2 | 8.3 | WSW | 1.6 | 3.8 | SE | AVERAGE | 6.0 |
| 2024-07-15 07:00 am | 5.2 | 4.9 | 8.3 | SW | 1.6 | 2.9 | SSE | AVERAGE | 5.8 |
| 2024-07-15 06:00 am | 5.6 | 5.2 | 8.3 | SW | 1.6 | 4.0 | SSE | AVERAGE | 5.9 |
| 2024-07-15 05:00 am | 5.6 | 5.2 | 8.3 | SW | 1.6 | 3.8 | SSE | AVERAGE | 5.8 |
| 2024-07-15 04:00 am | 5.6 | 5.2 | 8.3 | SW | 2.0 | 4.5 | S | AVERAGE | 5.8 |
| 2024-07-15 03:00 am | 5.6 | 5.2 | 8.3 | SW | 2.0 | 3.7 | SSE | AVERAGE | 5.9 |
| 2024-07-15 02:00 am | 6.2 | 5.6 | 8.3 | WSW | 2.3 | 4.3 | S | AVERAGE | 6.0 |
| 2024-07-15 01:00 am | 6.2 | 5.6 | 8.3 | SW | 3.0 | 5.0 | S | AVERAGE | 5.9 |
| 2024-07-15 12:00 am | 7.2 | 6.6 | 9.1 | SW | 3.0 | 4.3 | S | AVERAGE | 6.4 |
| 2024-07-14 11:00 pm | 7.2 | 6.6 | 8.3 | SW | 3.3 | 5.3 | S | STEEP | 6.2 |
| 2024-07-14 10:00 pm | 7.2 | 6.6 | 9.1 | WSW | 3.3 | 5.0 | SSW | AVERAGE | 6.4 |
| 2024-07-14 09:00 pm | 6.6 | 5.6 | 9.1 | SW | 3.3 | 4.2 | S | AVERAGE | 6.1 |
| 2024-07-14 08:00 pm | 7.2 | 6.2 | 8.3 | WSW | 3.9 | 5.3 | SW | STEEP | 6.1 |
| 2024-07-14 07:00 pm | 7.5 | 6.2 | 8.3 | SW | 4.6 | 6.2 | SSW | STEEP | 6.1 |
| 2024-07-14 06:00 pm | 8.2 | 6.6 | 8.3 | SW | 4.6 | 5.6 | S | STEEP | 6.1 |
Links which are specific to this station are listed below:
Real Time Data in tabular form for the last forty-five days.
Historical Data & Climatic Summaries for quality controlled data for prior months and years.
The weekly status report and the weekly maintenance report also provide valuable station information.
Note that the payload types and the station locations occasionally change.