


NDBC has recently revised the NDBC Handbook of Automated Data Quality Control Checks and Procedures. The new document can be found on our Publications page.
Station 46083 (LLNR 1082) - FAIRWEATHER GROUND - 105 NM West of Juneau, AK
Owned and maintained by National Data Buoy Center
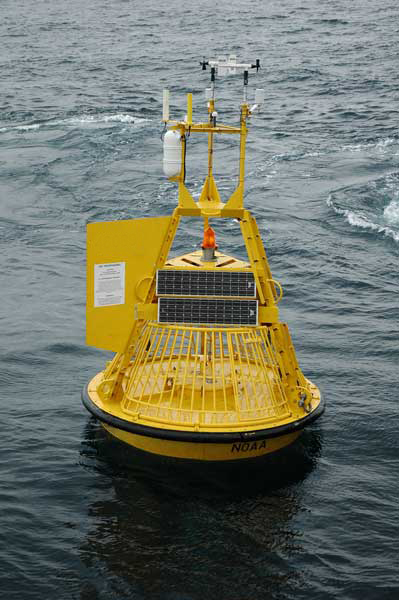
3-meter discus buoy w/ seal cage
ARES payload
58.270 N 138.019 W (58°16'12" N 138°1'8" W)
Site elevation: sea level
Air temp height: 4.4 m above site elevation
Anemometer height: 4.9 m above site elevation
Barometer elevation: 0.3 m above mean sea level
Sea temp depth: 0.6 m below water line
Water depth: 128.9 m
Watch circle radius: 191 yards
(24 hours for tsunami stations)
No Recent Reports
Links which are specific to this station are listed below:
Data for last 24 hours: No data available.
Data for last 5 days: No data available.
Data for last 45 days: No data available.
- Historical data (data descriptions)
- Standard meteorological data: 2001 2002 2003 2004 2005 2006 2007 2008 2009 2010 2011 2012 2013 2015 2016 2017 2018 2019 2020 2021 2022 2023 2024
- Continuous winds data: 2001 2002 2003 2004 2005 2006 2007 2008 2009 2010 2011 2012 2013 2015 2016 2017 2018 2019 2020 2021 2022 2023
- Spectral wave density data: 2001 2002 2003 2004 2005 2006 2007 2008 2009 2009b 2010 2011 2012 2013 2015 2016 2017 2018 2019 2020 2021 2022 2023 2024
- Spectral wave (alpha1) direction data: 2015 2016 2017 2018 2019 2020 2021 2022 2023 2024
- Spectral wave (alpha2) direction data: 2015 2016 2017 2018 2019 2020 2021 2022 2023 2024
- Spectral wave (r1) direction data: 2015 2016 2017 2018 2019 2020 2021 2022 2023 2024
- Spectral wave (r2) direction data: 2015 2016 2017 2018 2019 2020 2021 2022 2023 2024
- Supplemental measurements data: 2010 2011 2012 2013 2015 2016 2017 2018 2019 2020 2021 2022 2023 2024
- Search historical meteorological data for observations that meet your threshold conditions
- Climatic summary table (TXT) and plots of (description of tables and plots)
Some data files have been compressed with the GNU gzip program.
The weekly status report and the weekly maintenance report also provide valuable station information.
Note that the payload types and the station locations occasionally change.