


Station 46100 - OOI Westport Offshore
Station owned and maintained by NSF Ocean Observatories Initiative
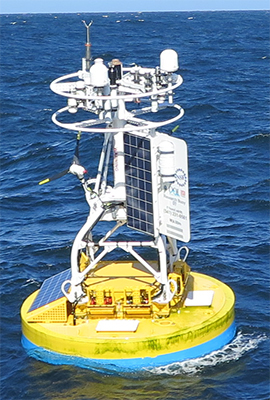
Buoy
46.851 N 124.964 W (46°51'5" N 124°57'51" W)
Site elevation: sea level
Air temp height: 4 m above site elevation
Anemometer height: 4.5 m above site elevation
Barometer elevation: 3.95 m above mean sea level
Sea temp depth: 1.15 m below water line
Large icon indicates selected station.
 Stations with recent data
 Stations with no data in last 8 hours
(24 hours for tsunami stations)
(24 hours for tsunami stations)
No Recent Reports
Links which are specific to this station are listed below:
Data for last 45 days: No data available.
- Historical data (data descriptions)
- Search historical meteorological data for observations that meet your threshold conditions
Some data files have been compressed with the GNU gzip program.