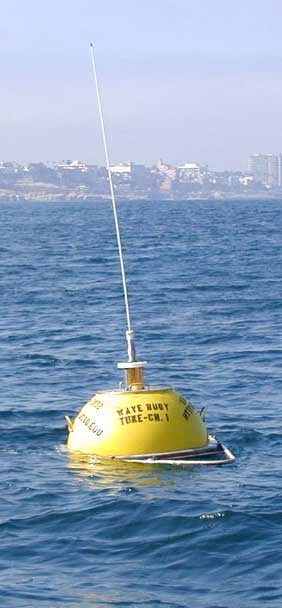
Station 46273 - Torrey Pines Inner, CA (101) Image indicating link to RSS feed of recent meteorological observations for station 46273


Conditions at 46273 as of
(5:26 pm PDT on 05/18/2024)
0026 GMT on 05/19/2024:
     

Click on the graph icon in the table below to see a time series plot of the last five days of that observation.

5-day plot - Wave Height Wave Height (WVHT): 0.8 m
5-day plot - Dominant Wave Period Dominant Wave Period (DPD): 20 sec
5-day plot - Average Wave Period Average Period (APD): 6.0 sec
5-day plot - Mean Wave Direction Mean Wave Direction (MWD): SW ( 236 deg true )
5-day plot - Water Temperature Water Temperature (WTMP): 18.5 °C
Previous observations
TIME
(PDT)
5-day plot - Wind Direction
WDIR
 
5-day plot - Wind Speed
WSPD
m/s
5-day plot - Wind Gust
GST
m/s
5-day plot - Wave Height
WVHT
m
5-day plot - Dominant Wave Period
DPD
sec
5-day plot - Average Wave Period
APD
sec
5-day plot - Mean Wave Direction
MWD
 
5-day plot - Atmospheric Pressure
PRES
mb
5-day plot - Pressure Tendency
PTDY
mb
5-day plot - Air Temperature
ATMP
°C
5-day plot - Water Temperature
WTMP
°C
5-day plot - Dew Point
DEWP
°C
5-day plot - Salinity
SAL
psu
5-day plot - Visibility
VIS
km
5-day plot - Tide (above MLLW)
TIDE
m
2024-05-18 04:56 pm--- 1.0 207.6 SW--- 18.5----
2024-05-18 04:26 pm--- 0.8 205.8 SW--- 18.4----
2024-05-18 03:56 pm--- 0.9 206.4 SW--- 18.4----
2024-05-18 03:26 pm--- 0.8 176.0WSW--- 18.3----
2024-05-18 02:56 pm--- 0.8 206.4 SW--- 18.3----
2024-05-18 02:26 pm--- 0.9 207.9WSW--- 18.3----
2024-05-18 01:56 pm--- 0.8 208.2WSW--- 18.3----
2024-05-18 01:26 pm--- 0.8 208.7WSW--- 18.3----
2024-05-18 12:56 pm--- 0.8 208.0 SW--- 18.3----
2024-05-18 12:26 pm--- 0.7 207.0WSW--- 18.3----
2024-05-18 11:56 am--- 0.8 207.9WSW--- 18.2----
2024-05-18 11:26 am--- 0.8 208.1 SW--- 18.0----
2024-05-18 10:56 am--- 0.7 207.2WSW--- 17.9----
2024-05-18 10:26 am--- 0.8 208.2WSW--- 17.8----
2024-05-18 09:56 am--- 0.8 207.5 SW--- 17.8----
2024-05-18 09:26 am--- 0.8 207.7 SW--- 17.9----
2024-05-18 08:56 am--- 0.8 207.8WSW--- 17.9----
2024-05-18 08:26 am--- 0.8 208.0WSW--- 17.8----
2024-05-18 07:56 am--- 0.8 177.7 SW--- 17.8----
2024-05-18 07:26 am--- 0.7 137.0 W--- 17.8----
2024-05-18 06:56 am--- 0.8 208.8WSW--- 17.8----
2024-05-18 06:26 am--- 0.8 207.9WSW--- 17.8----
2024-05-18 05:56 am--- 0.8 207.8WSW--- 17.8----
2024-05-18 05:26 am--- 0.8 207.6WSW--- 17.8----
2024-05-18 04:56 am--- 0.7 137.3 W--- 17.8----
2024-05-18 04:26 am--- 0.8 137.4 W--- 17.8----
2024-05-18 03:56 am--- 0.8 207.5WSW--- 17.9----
2024-05-18 03:26 am--- 0.8 187.0WSW--- 17.9----
2024-05-18 02:56 am--- 0.8 207.4 SW--- 17.8----
2024-05-18 02:26 am--- 0.8 136.9 W--- 17.9----
2024-05-18 01:56 am--- 0.8 227.0 SW--- 17.8----
2024-05-18 01:26 am--- 0.7 136.4 W--- 17.9----
2024-05-18 12:56 am--- 0.8 186.6WSW--- 17.9----
2024-05-18 12:26 am--- 0.8 226.4WSW--- 18.0----
2024-05-17 11:56 pm--- 0.8 186.6 SW--- 18.0----
2024-05-17 11:26 pm--- 0.8 186.6WSW--- 18.0----
2024-05-17 10:56 pm--- 0.8 186.1 SW--- 18.0----
2024-05-17 10:26 pm--- 0.7 186.0WSW--- 18.0----
2024-05-17 09:56 pm--- 0.8 185.6WSW--- 18.0----
2024-05-17 09:26 pm--- 0.8 185.7WSW--- 18.1----
2024-05-17 08:56 pm--- 0.8 135.6WSW--- 18.1----
2024-05-17 08:26 pm--- 0.8 185.4WSW--- 18.0----
2024-05-17 07:56 pm--- 0.8 145.5WSW--- 18.0----
2024-05-17 07:26 pm--- 0.7 115.1 W--- 18.0----
2024-05-17 06:56 pm--- 0.7 115.5 W--- 17.9----
2024-05-17 06:26 pm--- 0.8 185.7 SW--- 18.0----
2024-05-17 05:56 pm--- 0.7 185.3WSW--- 18.0----

Detailed Wave Summary
for 46273 as of
(5:26 pm PDT on 05/18/2024)
0026 GMT on 05/19/2024:

These wave data are displayed in rounded times.


Click on the graph icon in the table below to see a time series plot of the last five days of that observation.

5-day plot - Significant Wave Height Significant Wave Height (WVHT): 0.8 m
5-day plot - Swell Height Swell Height (SwH): 0.5 m
5-day plot - Swell Period Swell Period (SwP): 20.0 sec
5-day plot - Swell Direction Swell Direction (SwD): SW
5-day plot - Wind Wave Height Wind Wave Height (WWH): 0.6 m
5-day plot - Wind Wave Period Wind Wave Period (WWP): 9.1 sec
5-day plot - Wind Wave Direction Wind Wave Direction (WWD): W
5-day plot - Average Wave Period Average Wave Period (APD): 6.0 sec
Previous observations
TIME
(PDT)
5-day plot - Wave Height
WVHT
m
5-day plot - Swell Height
SwH
m
5-day plot - Swell Period
SwP
sec
5-day plot - Swell Direction
SwD
 
5-day plot - Wind Wave Height
WWH
m
5-day plot - Wind Wave Period
WWP
sec
5-day plot - Wind Wave Direction
WWD
 
5-day plot - Wave Steepness
STEEPNESS
 
5-day plot - Average Wave Period
APD
sec
2024-05-18 04:56 pm 0.9 0.8 20.0 SW 0.6 9.9 W SWELL 7.6
2024-05-18 04:26 pm 0.8 0.5 20.0 SW 0.6 9.1 W N/A 5.8
2024-05-18 03:56 pm 0.8 0.6 20.0 SW 0.6 9.9 W SWELL 6.4
2024-05-18 03:26 pm 0.8 0.6 16.7WSW 0.6 9.1 W SWELL 6.0
2024-05-18 02:56 pm 0.8 0.6 20.0 SW 0.5 9.9 W SWELL 6.4
2024-05-18 02:26 pm 0.9 0.7 20.0WSW 0.5 4.8 W SWELL 7.9
2024-05-18 01:56 pm 0.8 0.6 20.0WSW 0.5 9.9 W N/A 8.2
2024-05-18 01:26 pm 0.8 0.7 20.0WSW 0.5 5.3 W SWELL 8.7
2024-05-18 12:56 pm 0.8 0.6 20.0 SW 0.5 5.3 W N/A 8.0
2024-05-18 12:26 pm 0.7 0.5 20.0WSW 0.5 9.9 W N/A 7.0
2024-05-18 11:56 am 0.8 0.6 20.0WSW 0.5 9.9 W SWELL 7.9
2024-05-18 11:26 am 0.8 0.6 20.0 SW 0.5 9.9 W SWELL 8.1
2024-05-18 10:56 am 0.7 0.6 20.0WSW 0.5 4.8 W N/A 7.2
2024-05-18 10:26 am 0.8 0.7 20.0WSW 0.5 9.9 W SWELL 8.2
2024-05-18 09:56 am 0.8 0.6 20.0 SW 0.5 9.9 W N/A 7.5
2024-05-18 09:26 am 0.8 0.6 20.0 SW 0.5 5.6 W N/A 7.7
2024-05-18 08:56 am 0.8 0.6 20.0WSW 0.5 9.9 W SWELL 7.8
2024-05-18 08:26 am 0.8 0.7 20.0WSW 0.6 9.9 W SWELL 8.0
2024-05-18 07:56 am 0.8 0.6 16.7 SW 0.5 9.9 W N/A 7.7
2024-05-18 07:26 am 0.7 0.5 12.5 W 0.5 5.6 W N/A 7.0
2024-05-18 06:56 am 0.8 0.7 20.0WSW 0.5 9.1 W SWELL 8.8
2024-05-18 06:26 am 0.8 0.6 20.0WSW 0.5 9.9 W SWELL 7.9
2024-05-18 05:56 am 0.8 0.6 20.0WSW 0.5 9.9 W SWELL 7.8
2024-05-18 05:26 am 0.8 0.6 20.0WSW 0.5 5.0 W SWELL 7.6
2024-05-18 04:56 am 0.7 0.5 13.3 W 0.5 9.9 W N/A 7.3
2024-05-18 04:26 am 0.8 0.6 12.5 W 0.6 9.9 W N/A 7.4
2024-05-18 03:56 am 0.8 0.6 20.0WSW 0.5 5.6 W N/A 7.5
2024-05-18 03:26 am 0.8 0.5 18.2WSW 0.6 5.6 W N/A 7.0
2024-05-18 02:56 am 0.8 0.6 20.0 SW 0.6 5.6 W SWELL 7.4
2024-05-18 02:26 am 0.8 0.5 13.3 W 0.6 9.9 W N/A 6.9
2024-05-18 01:56 am 0.8 0.5 22.2 SW 0.5 5.6 W N/A 7.0
2024-05-18 01:26 am 0.7 0.5 13.3 W 0.6 9.9 W N/A 6.4
2024-05-18 12:56 am 0.8 0.5 18.2WSW 0.6 5.0 W N/A 6.6
2024-05-18 12:26 am 0.8 0.5 22.2WSW 0.6 5.3 W N/A 6.4
2024-05-17 11:56 pm 0.8 0.5 18.2 SW 0.6 5.6 W N/A 6.6
2024-05-17 11:26 pm 0.8 0.5 18.2WSW 0.6 9.9 W N/A 6.6
2024-05-17 10:56 pm 0.8 0.5 18.2 SW 0.6 9.9 W N/A 6.1
2024-05-17 10:26 pm 0.7 0.5 18.2WSW 0.6 5.6 W N/A 6.0
2024-05-17 09:56 pm 0.8 0.4 18.2WSW 0.6 5.0 W N/A 5.6
2024-05-17 09:26 pm 0.8 0.5 18.2WSW 0.6 5.6 W N/A 5.7
2024-05-17 08:56 pm 0.8 0.5 13.3WSW 0.6 5.0 WNW N/A 5.6
2024-05-17 08:26 pm 0.8 0.5 18.2WSW 0.7 5.9 W AVERAGE 5.4
2024-05-17 07:56 pm 0.8 0.5 14.3WSW 0.6 5.3 W N/A 5.5
2024-05-17 07:26 pm 0.7 0.4 10.5 W 0.6 9.9 W N/A 5.1
2024-05-17 06:56 pm 0.7 0.5 11.1 W 0.6 9.9 W N/A 5.5
2024-05-17 06:26 pm 0.8 0.5 18.2 SW 0.6 5.6 W N/A 5.7
2024-05-17 05:56 pm 0.7 0.4 18.2WSW 0.6 5.6 W N/A 5.3

Plot of wave energy versus frequency (and period)