


NDBC has recently revised the NDBC Handbook of Automated Data Quality Control Checks and Procedures. The new document can be found on our Publications page.
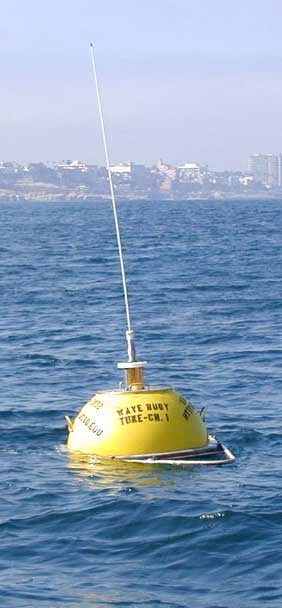
Station 46277 - Green Beach Offshore, CA (271) 
Information submitted by Scripps Institution of Oceanography
Waverider Buoy
33.336 N 117.659 W (33°20'11" N 117°39'31" W)
Site elevation: sea level
Air temp height: 2 m above site elevation
Water depth: 303 m
(24 hours for tsunami stations)
|
Click on the graph icon in the table below to see a time series plot of the last five days of that observation. | |
| 3.6 ft | |
| 17 sec | |
| 11.6 sec | |
| S ( 177 deg true ) | |
| 58.8 °F | |
| 62.2 °F | |
| TIME (PDT) |
WDIR |
WSPD kts |
GST kts |
WVHT ft |
DPD sec |
APD sec |
MWD |
PRES in |
PTDY in |
ATMP °F |
WTMP °F |
DEWP °F |
SAL psu |
VIS nmi |
TIDE ft |
|---|---|---|---|---|---|---|---|---|---|---|---|---|---|---|---|
| 2025-04-12 01:30 pm | - | - | - | 3.9 | 15 | 11.9 | S | - | - | 58.6 | 61.3 | - | - | - | - |
| 2025-04-12 01:00 pm | - | - | - | 4.3 | 17 | 12.1 | S | - | - | 58.3 | 61.0 | - | - | - | - |
| 2025-04-12 12:30 pm | - | - | - | 3.9 | 17 | 11.3 | S | - | - | 58.1 | 60.3 | - | - | - | - |
| 2025-04-12 12:00 pm | - | - | - | 4.3 | 17 | 12.0 | S | - | - | 57.9 | 59.9 | - | - | - | - |
| 2025-04-12 11:30 am | - | - | - | 3.6 | 15 | 11.0 | S | - | - | 57.9 | 59.7 | - | - | - | - |
| 2025-04-12 11:00 am | - | - | - | 4.3 | 17 | 12.3 | S | - | - | 57.4 | 59.5 | - | - | - | - |
| 2025-04-12 10:30 am | - | - | - | 3.3 | 17 | 11.2 | S | - | - | 57.4 | 59.7 | - | - | - | - |
| 2025-04-12 10:00 am | - | - | - | 3.9 | 17 | 11.6 | S | - | - | 57.6 | 59.7 | - | - | - | - |
| 2025-04-12 09:30 am | - | - | - | 3.6 | 17 | 11.2 | S | - | - | 57.0 | 59.7 | - | - | - | - |
| 2025-04-12 09:00 am | - | - | - | 3.9 | 17 | 12.0 | S | - | - | 55.9 | 59.7 | - | - | - | - |
| 2025-04-12 08:30 am | - | - | - | 3.6 | 17 | 11.3 | SSW | - | - | 55.9 | 59.7 | - | - | - | - |
| 2025-04-12 08:00 am | - | - | - | 4.3 | 17 | 11.9 | SSW | - | - | 55.8 | 59.7 | - | - | - | - |
| 2025-04-12 07:30 am | - | - | - | 4.3 | 17 | 12.3 | S | - | - | 55.6 | 59.9 | - | - | - | - |
| 2025-04-12 07:00 am | - | - | - | 4.6 | 17 | 12.2 | SSW | - | - | 55.8 | 59.9 | - | - | - | - |
| 2025-04-12 06:30 am | - | - | - | 3.9 | 17 | 11.5 | SSW | - | - | 55.0 | 59.9 | - | - | - | - |
| 2025-04-12 06:00 am | - | - | - | 3.6 | 17 | 11.2 | S | - | - | 54.9 | 59.9 | - | - | - | - |
| 2025-04-12 05:30 am | - | - | - | 3.9 | 17 | 12.0 | S | - | - | 54.7 | 59.9 | - | - | - | - |
| 2025-04-12 05:00 am | - | - | - | 4.3 | 17 | 12.4 | SSW | - | - | 54.9 | 59.9 | - | - | - | - |
| 2025-04-12 04:30 am | - | - | - | 4.6 | 17 | 12.7 | SSW | - | - | 55.2 | 59.9 | - | - | - | - |
| 2025-04-12 04:00 am | - | - | - | 4.3 | 17 | 12.6 | S | - | - | 55.8 | 59.7 | - | - | - | - |
| 2025-04-12 03:30 am | - | - | - | 3.9 | 17 | 12.2 | SSW | - | - | 56.3 | 59.9 | - | - | - | - |
| 2025-04-12 03:00 am | - | - | - | 3.6 | 17 | 11.9 | SSW | - | - | 56.3 | 60.3 | - | - | - | - |
| 2025-04-12 02:30 am | - | - | - | 3.6 | 17 | 11.9 | SSW | - | - | 56.1 | 60.4 | - | - | - | - |
| 2025-04-12 02:00 am | - | - | - | 3.9 | 17 | 12.2 | S | - | - | 56.1 | 60.6 | - | - | - | - |
| 2025-04-12 01:30 am | - | - | - | 3.3 | 17 | 11.6 | S | - | - | 55.8 | 60.8 | - | - | - | - |
| 2025-04-12 01:00 am | - | - | - | 3.3 | 17 | 11.8 | S | - | - | 56.3 | 61.0 | - | - | - | - |
| 2025-04-12 12:30 am | - | - | - | 3.0 | 17 | 11.3 | S | - | - | 56.7 | 60.8 | - | - | - | - |
| 2025-04-12 12:00 am | - | - | - | 3.3 | 17 | 11.8 | S | - | - | 57.4 | 61.0 | - | - | - | - |
| 2025-04-11 11:30 pm | - | - | - | 3.0 | 17 | 11.8 | S | - | - | 57.7 | 61.0 | - | - | - | - |
| 2025-04-11 11:00 pm | - | - | - | 3.6 | 18 | 13.2 | S | - | - | 57.9 | 61.3 | - | - | - | - |
| 2025-04-11 10:30 pm | - | - | - | 3.6 | 18 | 13.6 | S | - | - | 57.9 | 61.5 | - | - | - | - |
| 2025-04-11 10:00 pm | - | - | - | 3.0 | 17 | 11.8 | S | - | - | 58.1 | 61.9 | - | - | - | - |
| 2025-04-11 09:30 pm | - | - | - | 3.0 | 17 | 11.5 | S | - | - | 57.9 | 61.7 | - | - | - | - |
| 2025-04-11 09:00 pm | - | - | - | 3.3 | 17 | 11.9 | S | - | - | 57.9 | 61.5 | - | - | - | - |
| 2025-04-11 08:30 pm | - | - | - | 3.0 | 18 | 11.6 | S | - | - | 57.7 | 61.7 | - | - | - | - |
| 2025-04-11 08:00 pm | - | - | - | 3.3 | 18 | 12.0 | S | - | - | 57.7 | 61.9 | - | - | - | - |
| 2025-04-11 07:30 pm | - | - | - | 3.0 | 18 | 12.0 | S | - | - | 56.8 | 62.2 | - | - | - | - |
| 2025-04-11 07:00 pm | - | - | - | 3.0 | 18 | 11.4 | S | - | - | 56.7 | 63.0 | - | - | - | - |
| 2025-04-11 06:30 pm | - | - | - | 3.0 | 17 | 12.0 | SSW | - | - | 56.5 | 62.4 | - | - | - | - |
| 2025-04-11 06:00 pm | - | - | - | 3.3 | 18 | 12.9 | SSW | - | - | 56.1 | 63.0 | - | - | - | - |
| 2025-04-11 05:30 pm | - | - | - | 3.0 | 17 | 11.8 | SSW | - | - | 55.9 | 63.7 | - | - | - | - |
| 2025-04-11 05:00 pm | - | - | - | 3.0 | 18 | 11.2 | SSW | - | - | 56.3 | 64.6 | - | - | - | - |
| 2025-04-11 04:30 pm | - | - | - | 3.3 | 18 | 11.8 | S | - | - | 57.0 | 64.0 | - | - | - | - |
| 2025-04-11 04:00 pm | - | - | - | 3.0 | 18 | 10.8 | S | - | - | 57.0 | 63.9 | - | - | - | - |
| 2025-04-11 03:30 pm | - | - | - | 3.0 | 18 | 10.9 | S | - | - | 57.6 | 63.5 | - | - | - | - |
| 2025-04-11 03:00 pm | - | - | - | 3.3 | 18 | 11.5 | S | - | - | 56.8 | 63.5 | - | - | - | - |
| 2025-04-11 02:30 pm | - | - | - | 3.3 | 18 | 10.9 | S | - | - | 56.8 | 62.1 | - | - | - | - |
| 2025-04-11 02:00 pm | - | - | - | 3.0 | 18 | 10.1 | S | - | - | 56.5 | 62.6 | - | - | - | - |
|
These wave data are displayed in rounded times. Click on the graph icon in the table below to see a time series plot of the last five days of that observation. | |
| 3.6 ft | |
| 3.6 ft | |
| 16.7 sec | |
| S | |
| 1.6 ft | |
| 8.0 sec | |
| W | |
| SWELL | |
| 11.6 sec | |
| TIME (PDT) |
WVHT ft |
SwH ft |
SwP sec |
SwD |
WWH ft |
WWP sec |
WWD |
STEEPNESS |
APD sec |
|---|---|---|---|---|---|---|---|---|---|
| 2025-04-12 01:30 pm | 3.9 | 3.6 | 15.4 | S | 1.3 | 8.0 | W | SWELL | 11.9 |
| 2025-04-12 01:00 pm | 4.3 | 3.9 | 16.7 | S | 1.6 | 8.7 | WSW | SWELL | 12.1 |
| 2025-04-12 12:30 pm | 3.6 | 3.6 | 16.7 | S | 1.6 | 9.5 | WSW | SWELL | 11.3 |
| 2025-04-12 12:00 pm | 4.3 | 3.9 | 16.7 | S | 1.6 | 6.9 | W | SWELL | 12.0 |
| 2025-04-12 11:30 am | 3.6 | 3.3 | 15.4 | S | 1.3 | 8.3 | W | SWELL | 11.0 |
| 2025-04-12 11:00 am | 4.3 | 3.9 | 16.7 | S | 1.6 | 7.7 | W | SWELL | 12.3 |
| 2025-04-12 10:30 am | 3.3 | 3.0 | 16.7 | S | 1.3 | 9.5 | WSW | SWELL | 11.2 |
| 2025-04-12 10:00 am | 3.6 | 3.6 | 16.7 | S | 1.6 | 6.9 | W | SWELL | 11.6 |
| 2025-04-12 09:30 am | 3.6 | 3.3 | 16.7 | S | 1.6 | 9.5 | SW | SWELL | 11.2 |
| 2025-04-12 09:00 am | 3.9 | 3.6 | 16.7 | S | 1.6 | 9.1 | WSW | SWELL | 12.0 |
| 2025-04-12 08:30 am | 3.6 | 3.3 | 16.7 | SSW | 1.6 | 9.5 | WSW | SWELL | 11.3 |
| 2025-04-12 08:00 am | 3.9 | 3.9 | 16.7 | SSW | 1.6 | 5.9 | W | SWELL | 11.9 |
| 2025-04-12 07:30 am | 4.3 | 3.9 | 16.7 | S | 1.6 | 7.1 | W | SWELL | 12.3 |
| 2025-04-12 07:00 am | 4.6 | 4.3 | 16.7 | SSW | 1.6 | 7.4 | W | SWELL | 12.2 |
| 2025-04-12 06:30 am | 3.9 | 3.6 | 16.7 | SSW | 1.3 | 8.7 | W | SWELL | 11.5 |
| 2025-04-12 06:00 am | 3.6 | 3.6 | 16.7 | S | 1.3 | 7.7 | W | SWELL | 11.2 |
| 2025-04-12 05:30 am | 3.9 | 3.6 | 16.7 | S | 1.3 | 9.5 | SW | SWELL | 12.0 |
| 2025-04-12 05:00 am | 4.3 | 3.9 | 16.7 | SSW | 1.3 | 9.1 | WSW | SWELL | 12.4 |
| 2025-04-12 04:30 am | 4.6 | 4.3 | 16.7 | SSW | 1.3 | 9.5 | WSW | SWELL | 12.7 |
| 2025-04-12 04:00 am | 3.9 | 3.9 | 16.7 | S | 1.3 | 9.5 | WSW | SWELL | 12.6 |
| 2025-04-12 03:30 am | 3.9 | 3.6 | 16.7 | SSW | 1.3 | 8.7 | W | SWELL | 12.2 |
| 2025-04-12 03:00 am | 3.6 | 3.6 | 16.7 | SSW | 1.3 | 8.7 | W | SWELL | 11.9 |
| 2025-04-12 02:30 am | 3.6 | 3.3 | 16.7 | SSW | 1.3 | 7.1 | W | SWELL | 11.9 |
| 2025-04-12 02:00 am | 3.9 | 3.6 | 16.7 | S | 1.3 | 9.5 | SW | SWELL | 12.2 |
| 2025-04-12 01:30 am | 3.3 | 3.3 | 16.7 | S | 1.3 | 9.1 | SW | SWELL | 11.6 |
| 2025-04-12 01:00 am | 3.3 | 3.0 | 16.7 | S | 1.3 | 7.4 | W | SWELL | 11.8 |
| 2025-04-12 12:30 am | 3.0 | 2.6 | 16.7 | S | 1.3 | 9.5 | WSW | SWELL | 11.3 |
| 2025-04-12 12:00 am | 3.3 | 3.0 | 16.7 | S | 1.3 | 7.4 | W | SWELL | 11.8 |
| 2025-04-11 11:30 pm | 3.0 | 2.6 | 16.7 | S | 1.3 | 9.5 | WSW | SWELL | 11.8 |
| 2025-04-11 11:00 pm | 3.6 | 3.3 | 18.2 | S | 1.3 | 9.5 | WSW | SWELL | 13.2 |
| 2025-04-11 10:30 pm | 3.6 | 3.6 | 18.2 | S | 1.0 | 9.5 | WSW | SWELL | 13.6 |
| 2025-04-11 10:00 pm | 3.0 | 2.6 | 16.7 | S | 1.0 | 9.5 | SW | SWELL | 11.8 |
| 2025-04-11 09:30 pm | 3.0 | 2.6 | 16.7 | S | 1.0 | 7.7 | W | SWELL | 11.5 |
| 2025-04-11 09:00 pm | 3.3 | 3.0 | 16.7 | S | 1.3 | 9.1 | WSW | SWELL | 11.9 |
| 2025-04-11 08:30 pm | 3.0 | 2.6 | 18.2 | S | 1.0 | 9.5 | WSW | SWELL | 11.6 |
| 2025-04-11 08:00 pm | 3.3 | 3.0 | 18.2 | S | 1.3 | 9.5 | WSW | SWELL | 12.0 |
| 2025-04-11 07:30 pm | 3.0 | 3.0 | 18.2 | S | 1.0 | 9.1 | WSW | SWELL | 12.0 |
| 2025-04-11 07:00 pm | 2.6 | 2.6 | 18.2 | S | 1.3 | 9.5 | WSW | SWELL | 11.4 |
| 2025-04-11 06:30 pm | 3.0 | 3.0 | 16.7 | SSW | 1.3 | 9.5 | WSW | SWELL | 12.0 |
| 2025-04-11 06:00 pm | 3.3 | 3.3 | 18.2 | SSW | 1.3 | 9.5 | WSW | SWELL | 12.9 |
| 2025-04-11 05:30 pm | 3.0 | 2.6 | 16.7 | SSW | 1.3 | 8.3 | W | SWELL | 11.8 |
| 2025-04-11 05:00 pm | 3.0 | 2.6 | 18.2 | SSW | 1.3 | 9.5 | W | SWELL | 11.2 |
| 2025-04-11 04:30 pm | 3.3 | 3.0 | 18.2 | S | 1.3 | 9.1 | W | SWELL | 11.8 |
| 2025-04-11 04:00 pm | 3.0 | 2.6 | 18.2 | S | 1.6 | 9.5 | W | SWELL | 10.8 |
| 2025-04-11 03:30 pm | 3.0 | 2.6 | 18.2 | S | 1.3 | 9.5 | W | SWELL | 10.9 |
| 2025-04-11 03:00 pm | 3.3 | 3.0 | 18.2 | S | 1.6 | 8.3 | W | SWELL | 11.5 |
| 2025-04-11 02:30 pm | 3.3 | 2.6 | 18.2 | S | 1.6 | 9.5 | W | SWELL | 10.9 |
| 2025-04-11 02:00 pm | 3.0 | 2.6 | 18.2 | S | 1.6 | 9.1 | W | SWELL | 10.1 |
Disclaimer: Ocean current directions are reported to the nearest 10 degrees and speeds are measured to the nearest whole centimeter per second.
Ocean Current Data for 46277
| 2:00 pm PDT | 1:30 pm PDT | 1:00 pm PDT | 12:30 pm PDT | 12:00 pm PDT | 11:30 am PDT | 11:00 am PDT | 10:30 am PDT | |||||||||
|---|---|---|---|---|---|---|---|---|---|---|---|---|---|---|---|---|
| Depth ft | Dir ° | Speed kts |
Dir ° | Speed kts |
Dir ° | Speed kts |
Dir ° | Speed kts |
Dir ° | Speed kts |
Dir ° | Speed kts |
Dir ° | Speed kts |
Dir ° | Speed kts |
| 3 | 80 | 0.68 | 70 | 0.60 | 80 | 0.56 | 80 | 0.64 | 70 | 0.58 | 60 | 0.64 | 70 | 0.58 | 60 | 0.45 |
Previous (up to 48) reports of ocean current data for 46277
Ocean Current Stick Plots are available in metric units only:
All Instruments -  1-day plot 3-day plot 5-day plot
Links which are specific to this station are listed below:
Real Time Data in tabular form for the last forty-five days.
Historical Data & Climatic Summaries for quality controlled data for prior months and years.