


NDBC has recently revised the NDBC Handbook of Automated Data Quality Control Checks and Procedures. The new document can be found on our Publications page.
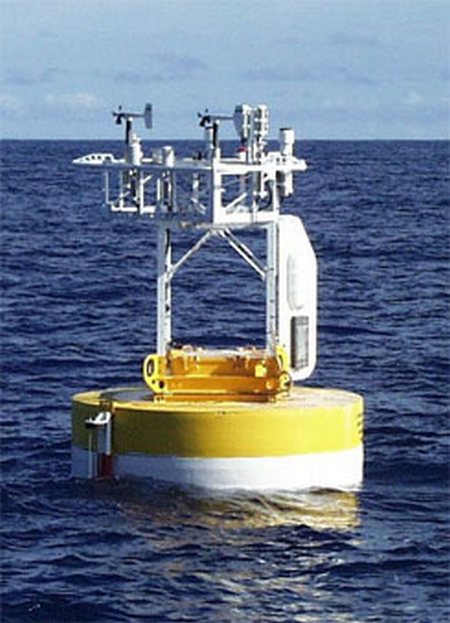
Station 51WH0 - WHOTS - Woods Hole Ocean Time-series 
Owned and maintained by Woods Hole Oceanographic Institution
Moored Buoy
WAMDAS payload
22.000 N 157.000 W (22°0'0" N 157°0'0" W)
Site elevation: sea level
Air temp height: 2.45 m above site elevation
Anemometer height: 2.66 m above site elevation
Barometer elevation: 2.43 m above mean sea level
Sea temp depth: 1.5 m below water line
Water depth: 4750 m
(24 hours for tsunami stations)
|
Click on the graph icon in the table below to see a time series plot of the last five days of that observation. | |
| E ( 80 deg true ) | |
| 15.5 kts | |
| 30.09 in | |
| 75.6 °F | |
| 76.3 °F | |
| 67.1 °F | |
| 17.5 kts | |
| 19.4 kts | |
| TIME (HAST) |
WDIR |
WSPD kts |
GST kts |
WVHT ft |
DPD sec |
APD sec |
MWD |
PRES in |
PTDY in |
ATMP °F |
WTMP °F |
DEWP °F |
SAL psu |
VIS nmi |
TIDE ft |
|---|---|---|---|---|---|---|---|---|---|---|---|---|---|---|---|
| 2025-04-12 11:30 pm | E | 15.5 | - | - | - | - | - | 30.11 | - | 75.7 | 76.5 | 68.4 | - | - | - |
| 2025-04-12 10:30 pm | E | 13.6 | - | - | - | - | - | 30.14 | - | - | 76.5 | - | 34.80 | - | - |
| 2025-04-12 09:30 pm | E | 17.5 | - | - | - | - | - | 30.13 | - | - | 76.5 | - | 34.80 | - | - |
| 2025-04-12 08:30 pm | E | 15.5 | - | - | - | - | - | 30.12 | - | - | 76.5 | - | 34.80 | - | - |
| 2025-04-12 07:30 pm | E | 15.5 | - | - | - | - | - | 30.09 | - | 75.9 | 76.3 | 68.0 | - | - | - |
| 2025-04-12 06:30 pm | E | 15.5 | - | - | - | - | - | 30.07 | - | 75.9 | 76.5 | 68.4 | - | - | - |
| 2025-04-12 05:30 pm | E | 13.6 | - | - | - | - | - | 30.08 | - | - | 76.3 | - | 34.90 | - | - |
| 2025-04-12 04:30 pm | ESE | 15.5 | - | - | - | - | - | 30.08 | - | - | 76.3 | - | 34.90 | - | - |
| 2025-04-12 03:30 pm | ESE | 15.5 | - | - | - | - | - | 30.08 | - | - | 76.3 | - | 34.90 | - | - |
| 2025-04-12 02:30 pm | ESE | 17.5 | - | - | - | - | - | 30.09 | - | - | 76.3 | - | 34.90 | - | - |
| 2025-04-12 01:30 pm | ESE | 17.5 | - | - | - | - | - | 30.11 | - | - | 76.3 | - | 34.90 | - | - |
| 2025-04-12 12:30 pm | ESE | 13.6 | - | - | - | - | - | 30.13 | - | - | 76.3 | - | 34.90 | - | - |
| 2025-04-12 11:30 am | E | 15.5 | - | - | - | - | - | 30.14 | - | - | 76.3 | - | 34.90 | - | - |
| 2025-04-12 10:30 am | E | 13.6 | - | - | - | - | - | 30.14 | - | - | 76.3 | - | 34.90 | - | - |
| 2025-04-12 09:30 am | E | 13.6 | - | - | - | - | - | 30.12 | - | 75.6 | 76.3 | 69.1 | - | - | - |
| 2025-04-12 08:30 am | ESE | 13.6 | - | - | - | - | - | 30.13 | - | - | 76.3 | - | 34.90 | - | - |
| 2025-04-12 07:30 am | E | 13.6 | - | - | - | - | - | 30.10 | - | 75.7 | 76.3 | 68.7 | - | - | - |
| 2025-04-12 06:30 am | ESE | 13.6 | - | - | - | - | - | 30.09 | - | - | 76.3 | - | 34.90 | - | - |
| 2025-04-12 05:30 am | ESE | 13.6 | - | - | - | - | - | 30.08 | - | - | 76.3 | - | 34.90 | - | - |
| 2025-04-12 04:30 am | ESE | 11.7 | - | - | - | - | - | 30.08 | - | - | 76.3 | - | 34.90 | - | - |
| 2025-04-12 03:30 am | ESE | 13.6 | - | - | - | - | - | 30.08 | - | - | 76.3 | - | 34.90 | - | - |
| 2025-04-12 02:30 am | E | 11.7 | - | - | - | - | - | 30.09 | - | - | 76.3 | - | 34.80 | - | - |
| 2025-04-12 01:30 am | E | 15.5 | - | - | - | - | - | 30.09 | - | 73.0 | 76.3 | 69.1 | - | - | - |
|
These oceanographic data are displayed in rounded times. Click on the graph icon in the table below to see a time series plot of the last five days of that observation. | |
| Depth (DEPTH): | 3.3 ft |
| 76.28 °F | |
| TIME (HAST) |
DEPTH ft |
OTMP °F |
COND mS/cm |
SAL psu |
O2% % |
O2PPM ppm |
CLCON ug/l |
TURB FTU |
PH |
EH mv |
|---|---|---|---|---|---|---|---|---|---|---|
| 2025-04-12 11:30 pm | 3.3 | 76.46 | - | - | - | - | - | - | - | - |
| 2025-04-12 10:30 pm | 3.3 | 76.46 | - | 34.80 | - | - | - | - | - | - |
| 2025-04-12 09:30 pm | 3.3 | 76.46 | - | 34.80 | - | - | - | - | - | - |
| 2025-04-12 08:30 pm | 3.3 | 76.46 | - | 34.80 | - | - | - | - | - | - |
| 2025-04-12 07:30 pm | 3.3 | 76.28 | - | - | - | - | - | - | - | - |
| 2025-04-12 06:30 pm | 3.3 | 76.46 | - | - | - | - | - | - | - | - |
| 2025-04-12 05:30 pm | 3.3 | 76.28 | - | 34.90 | - | - | - | - | - | - |
| 2025-04-12 04:30 pm | 3.3 | 76.28 | - | 34.90 | - | - | - | - | - | - |
| 2025-04-12 03:30 pm | 3.3 | 76.28 | - | 34.90 | - | - | - | - | - | - |
| 2025-04-12 02:30 pm | 3.3 | 76.28 | - | 34.90 | - | - | - | - | - | - |
| 2025-04-12 01:30 pm | 3.3 | 76.28 | - | 34.90 | - | - | - | - | - | - |
| 2025-04-12 12:30 pm | 3.3 | 76.28 | - | 34.90 | - | - | - | - | - | - |
| 2025-04-12 11:30 am | 3.3 | 76.28 | - | 34.90 | - | - | - | - | - | - |
| 2025-04-12 10:30 am | 3.3 | 76.28 | - | 34.90 | - | - | - | - | - | - |
| 2025-04-12 09:30 am | 3.3 | 76.28 | - | - | - | - | - | - | - | - |
| 2025-04-12 08:30 am | 3.3 | 76.28 | - | 34.90 | - | - | - | - | - | - |
| 2025-04-12 07:30 am | 3.3 | 76.28 | - | - | - | - | - | - | - | - |
| 2025-04-12 06:30 am | 3.3 | 76.28 | - | 34.90 | - | - | - | - | - | - |
| 2025-04-12 05:30 am | 3.3 | 76.28 | - | 34.90 | - | - | - | - | - | - |
| 2025-04-12 04:30 am | 3.3 | 76.28 | - | 34.90 | - | - | - | - | - | - |
| 2025-04-12 03:30 am | 3.3 | 76.28 | - | 34.90 | - | - | - | - | - | - |
| 2025-04-12 02:30 am | 3.3 | 76.28 | - | 34.80 | - | - | - | - | - | - |
| 2025-04-12 01:30 am | 3.3 | 76.28 | - | - | - | - | - | - | - | - |
|
Click on the graph icon in the table below to see a time series plot of the last five days of that observation. | ||
| 4.8 | watts/meter2 | |
| 368.5 | watts/meter2 | |
| TIME (HAST) |
SRAD1 w/m2 |
SRAD2 w/m2 |
LRAD w/m2 |
|---|---|---|---|
| 2025-04-12 11:30 pm | - | 4.8 | 370.8 |
| 2025-04-12 10:30 pm | - | 5.0 | 369.1 |
| 2025-04-12 09:30 pm | - | 5.2 | 401.2 |
| 2025-04-12 08:30 pm | - | 5.2 | 396.8 |
| 2025-04-12 07:30 pm | - | 5.6 | 398.9 |
| 2025-04-12 06:30 pm | - | 40.7 | 409.0 |
| 2025-04-12 05:30 pm | - | 213.6 | 413.1 |
| 2025-04-12 04:30 pm | - | 257.8 | 407.7 |
| 2025-04-12 03:30 pm | - | 396.1 | 414.3 |
| 2025-04-12 02:30 pm | - | 549.9 | 407.9 |
| 2025-04-12 01:30 pm | - | 610.8 | 405.3 |
| 2025-04-12 12:30 pm | - | 552.3 | 410.6 |
| 2025-04-12 11:30 am | - | 708.3 | 408.8 |
| 2025-04-12 10:30 am | - | 668.2 | 398.8 |
| 2025-04-12 09:30 am | - | 608.0 | 397.6 |
| 2025-04-12 08:30 am | - | 358.3 | 383.9 |
| 2025-04-12 07:30 am | - | 135.1 | 385.2 |
| 2025-04-12 06:30 am | - | 23.0 | 390.7 |
| 2025-04-12 05:30 am | - | 4.9 | 399.5 |
| 2025-04-12 04:30 am | - | 5.5 | 388.4 |
| 2025-04-12 03:30 am | - | 5.7 | 405.9 |
| 2025-04-12 02:30 am | - | 5.4 | 411.0 |
| 2025-04-12 01:30 am | - | 5.8 | 418.7 |
Links which are specific to this station are listed below:
Real Time Data in tabular form for the last forty-five days.
Historical Data & Climatic Summaries for quality controlled data for prior months and years.