


NDBC has recently revised the NDBC Handbook of Automated Data Quality Control Checks and Procedures. The new document can be found on our Publications page.
Station 41001 (LLNR 635) - EAST HATTERAS - 150 NM East of Cape Hatteras
Owned and maintained by National Data Buoy Center
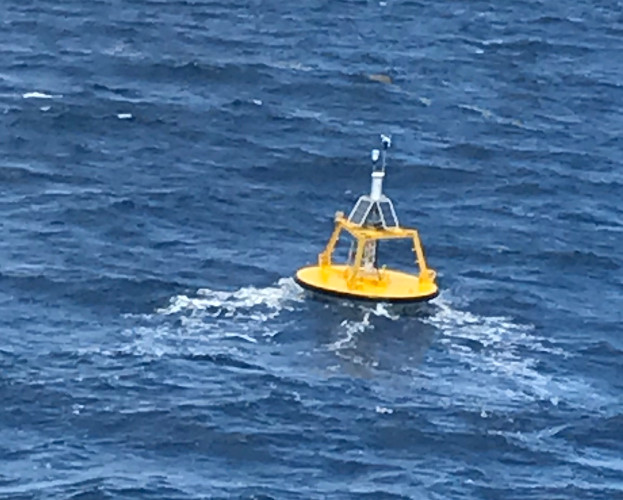
3-meter discus buoy
SCOOP payload
34.703 N 72.242 W (34°42'9" N 72°14'31" W)
Site elevation: sea level
Air temp height: 3.4 m above site elevation
Anemometer height: 3.8 m above site elevation
Barometer elevation: 2.4 m above mean sea level
Sea temp depth: 2 m below water line
Water depth: 4501 m
Watch circle radius: 4571 yards
(24 hours for tsunami stations)
No Recent Reports
Links which are specific to this station are listed below:
Data for last 24 hours: No data available.
Data for last 5 days: No data available.
Data for last 45 days: No data available.
- Historical data (data descriptions)
- Standard meteorological data: 1976 1977 1978 1979 1980 1981 1982 1983 1984 1985 1986 1987 1988 1989 1990 1991 1992 1993 1994 1995 1996 1997 1998 1999 2000 2001 2002 2003 2004 2005 2006 2007 2008 2010 2011 2012 2013 2015 2016 2017 2019 2020 2021 2022 2023 2024
- Continuous winds data: 1990 1991 1992 1993 1996 1997 1998 1999 2000 2001 2002 2003 2004 2005 2006 2007 2008 2010 2011 2012
- Spectral wave density data: 1996 1997 1998 1999 2000 2001 2002 2003 2004 2005 2006 2007 2008 2010 2011 2012 2013 2015 2016 2017 2019 2020 2021 2022 2023 2024
- Spectral wave (alpha1) direction data: 2012 2013 2015 2016 2017 2019 2020 2021 2022 2023 2024
- Spectral wave (alpha2) direction data: 2012 2013 2015 2016 2017 2019 2020 2021 2022 2023 2024
- Spectral wave (r1) direction data: 2012 2013 2015 2016 2017 2019 2020 2021 2022 2023 2024
- Spectral wave (r2) direction data: 2012 2013 2015 2016 2017 2019 2020 2021 2022 2023 2024
- Ocean current data: 2010
- Supplemental measurements data: 2015 2016 2017 2019 2020 2021 2022 2023 2024
- Search historical meteorological data for observations that meet your threshold conditions
- Climatic summary table (TXT) and plots of (description of tables and plots)
Some data files have been compressed with the GNU gzip program.
The weekly status report and the weekly maintenance report also provide valuable station information.
Note that the payload types and the station locations occasionally change.