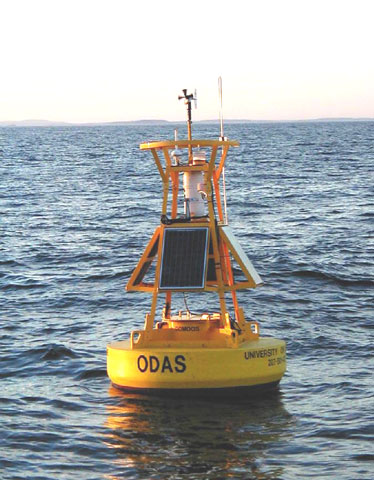
Station 44029 - Buoy A01 - Massachusetts Bay ![Image indicating link to RSS feed of recent meteorological observations for station 44029](/images/feed-icon-14x14.png)
Previous observations
TIME (EDT) |
![5-day plot - Wind Direction 5-day plot - Wind Direction](/images/graph04.gif) WDIR |
![5-day plot - Wind Speed 5-day plot - Wind Speed](/images/graph04.gif) WSPD kts |
![5-day plot - Wind Gust 5-day plot - Wind Gust](/images/graph04.gif) GST kts |
![5-day plot - Wave Height 5-day plot - Wave Height](/images/graph04.gif) WVHT ft |
![5-day plot - Dominant Wave Period 5-day plot - Dominant Wave Period](/images/graph04.gif) DPD sec |
![5-day plot - Average Wave Period 5-day plot - Average Wave Period](/images/graph04.gif) APD sec |
![5-day plot - Mean Wave Direction 5-day plot - Mean Wave Direction](/images/graph04.gif) MWD |
![5-day plot - Atmospheric Pressure 5-day plot - Atmospheric Pressure](/images/graph04.gif) PRES in |
![5-day plot - Pressure Tendency 5-day plot - Pressure Tendency](/images/graph04.gif) PTDY in |
![5-day plot - Air Temperature 5-day plot - Air Temperature](/images/graph04.gif) ATMP °F |
![5-day plot - Water Temperature 5-day plot - Water Temperature](/images/graph04.gif) WTMP °F |
![5-day plot - Dew Point 5-day plot - Dew Point](/images/graph04.gif) DEWP °F |
![5-day plot - Salinity 5-day plot - Salinity](/images/graph04.gif) SAL psu |
![5-day plot - Visibility 5-day plot - Visibility](/images/graph04.gif) VIS nmi |
![5-day plot - Tide (above MLLW) 5-day plot - Tide (above MLLW)](/images/graph04.gif) TIDE ft |
2024-07-19 04:04 pm | S | 7.8 | 7.8 | 1.6 | 8 | - | - | 30.08 | - | 68.7 | 67.5 | - | 30.60 | 1.6 | - |
2024-07-19 03:04 pm | S | 5.8 | 7.8 | 1.3 | 8 | - | - | 30.08 | - | 68.2 | 66.9 | - | 30.60 | 1.6 | - |
2024-07-19 02:04 pm | S | 5.8 | 5.8 | 1.3 | 8 | - | - | 30.09 | - | 67.5 | 65.1 | - | 30.60 | 1.6 | - |
2024-07-19 01:04 pm | S | 3.9 | 5.8 | 1.3 | 8 | - | - | 30.09 | - | 67.1 | 64.6 | - | 30.60 | 1.6 | - |
2024-07-19 12:04 pm | SSW | 3.9 | 5.8 | 1.6 | 8 | - | - | 30.09 | - | 66.6 | 64.2 | - | 30.60 | 1.6 | - |
2024-07-19 11:04 am | SW | 5.8 | 5.8 | 1.6 | 8 | - | - | 30.08 | - | 65.7 | 63.7 | - | 30.60 | 1.6 | - |
2024-07-19 10:04 am | NW | 1.9 | 3.9 | 1.6 | 8 | - | - | 30.08 | - | 65.8 | 63.5 | - | 30.60 | 1.6 | - |
2024-07-19 09:04 am | NW | 5.8 | 5.8 | 1.6 | 8 | - | - | 30.07 | - | 66.9 | 62.8 | - | 30.70 | 1.6 | - |
2024-07-19 08:04 am | NW | 5.8 | 7.8 | 1.6 | 8 | - | - | 30.06 | - | 63.7 | 62.4 | - | 30.70 | 1.6 | - |
2024-07-19 07:04 am | NW | 5.8 | 5.8 | 1.6 | 8 | - | - | 30.04 | - | 64.4 | 62.2 | - | 30.60 | 1.6 | - |
2024-07-19 06:04 am | NW | 5.8 | 7.8 | 1.6 | 8 | - | - | 30.02 | - | 63.5 | 62.4 | - | 30.60 | 1.6 | - |
2024-07-19 05:04 am | NNW | 5.8 | 7.8 | 1.6 | 8 | - | - | 30.00 | - | 63.3 | 62.6 | - | 30.60 | 1.6 | - |
2024-07-19 04:04 am | NNW | 7.8 | 7.8 | 2.0 | 8 | - | - | 29.99 | - | 63.5 | 62.4 | - | 30.50 | 1.6 | - |
2024-07-19 03:04 am | N | 7.8 | 9.7 | 1.6 | 8 | - | - | 29.98 | - | 64.4 | 61.9 | - | 30.50 | 1.6 | - |
2024-07-19 02:04 am | N | 9.7 | 9.7 | 1.3 | 8 | - | - | 29.97 | - | 65.3 | 61.0 | - | 30.60 | 1.6 | - |
2024-07-19 01:04 am | WNW | 5.8 | 5.8 | 1.6 | 8 | - | - | 29.96 | - | 63.5 | 61.5 | - | 30.60 | 1.6 | - |
2024-07-19 12:04 am | NW | 5.8 | 7.8 | 1.6 | 8 | - | - | 29.94 | - | 64.8 | 62.1 | - | 30.60 | 1.6 | - |
2024-07-18 11:04 pm | WNW | 7.8 | 7.8 | 1.6 | 8 | - | - | 29.92 | - | 65.8 | 62.1 | - | 30.60 | 1.6 | - |
2024-07-18 10:04 pm | W | 5.8 | 7.8 | 1.6 | 8 | - | - | 29.90 | - | 66.6 | 62.6 | - | 30.50 | 1.6 | - |
2024-07-18 09:04 pm | W | 7.8 | 7.8 | 1.6 | 8 | - | - | 29.89 | - | 68.5 | 63.1 | - | 30.60 | 1.6 | - |
2024-07-18 08:04 pm | W | 5.8 | 5.8 | 1.6 | 8 | - | - | 29.87 | - | 68.5 | 63.0 | - | 30.60 | 1.6 | - |
2024-07-18 07:04 pm | SW | 5.8 | 5.8 | 1.6 | 8 | - | - | 29.85 | - | 67.5 | 63.5 | - | 30.60 | 1.6 | - |
2024-07-18 06:04 pm | SSW | 5.8 | 5.8 | 1.6 | 8 | - | - | 29.84 | - | 68.4 | 62.8 | - | 30.70 | 1.6 | - |
Disclaimer: Ocean current directions are reported to the nearest 10 degrees and speeds are measured to the nearest whole centimeter per second.
Ocean Current Data for 44029
Depth ft |
7 |
260 | 0.16 | 250 | 0.31 | 220 | 0.27 |
33 |
230 | 0.47 | 220 | 0.35 | 200 | 0.29 |
46 |
230 | 0.43 | 210 | 0.21 | 190 | 0.23 |
59 |
230 | 0.43 | 200 | 0.27 | 190 | 0.29 |
72 |
220 | 0.41 | 200 | 0.27 | 190 | 0.25 |
85 |
220 | 0.39 | 200 | 0.21 | 190 | 0.17 |
98 |
220 | 0.31 | 220 | 0.12 | 180 | 0.10 |
112 |
210 | 0.25 | 150 | 0.08 | 120 | 0.16 |
125 |
200 | 0.17 | 60 | 0.06 | 100 | 0.14 |
138 |
200 | 0.08 | 10 | 0.10 | 80 | 0.10 |
151 |
220 | 0.06 | 10 | 0.10 | 70 | 0.10 |
164 |
220 | 0.08 | 0 | 0.10 | 80 | 0.10 |
177 |
210 | 0.08 | 20 | 0.06 | 80 | 0.17 |
190 |
200 | 0.06 | 50 | 0.10 | 80 | 0.19 |
Previous (up to 48) reports of ocean current data for 44029
Ocean Current Stick Plots are available in metric units only:
All Instruments -
1-day plot
3-day plot
5-day plot
These oceanographic data are displayed in rounded times.
Click on the graph icon in the table below to see a time series plot of the last five days of that observation. |
Depth (DEPTH): | 3.3 ft |
Ocean Temperature (OTMP): | 66.38 °F |
Salinity (SAL): | 30.50 psu |
Previous observations
TIME (EDT) |
DEPTH ft |
![5-day plot - Ocean Temperature 5-day plot - Ocean Temperature](/images/graph04.gif) OTMP °F |
![5-day plot - Conductivity 5-day plot - Conductivity](/images/graph04.gif) COND mS/cm |
![5-day plot - Salinity 5-day plot - Salinity](/images/graph04.gif) SAL psu |
![5-day plot - Oxygen Concentration 5-day plot - Oxygen Concentration](/images/graph04.gif) O2% % |
![5-day plot - Oxygen Concentration 5-day plot - Oxygen Concentration](/images/graph04.gif) O2PPM ppm |
![5-day plot - Chlorophyll 5-day plot - Chlorophyll](/images/graph04.gif) CLCON ug/l |
![5-day plot - Turbidity 5-day plot - Turbidity](/images/graph04.gif) TURB FTU |
![5-day plot - pH 5-day plot - pH](/images/graph04.gif) PH |
![5-day plot - Eh 5-day plot - Eh](/images/graph04.gif) EH mv |
2024-07-19 04:04 pm | 3.3 | 67.46 | - | 30.60 | - | - | - | - | - | - |
2024-07-19 03:04 pm | 3.3 | 66.92 | - | 30.60 | - | - | - | - | - | - |
2024-07-19 02:04 pm | 3.3 | 65.12 | - | 30.60 | - | - | - | - | - | - |
2024-07-19 01:04 pm | 3.3 | 64.58 | - | 30.60 | - | - | - | - | - | - |
2024-07-19 12:04 pm | 3.3 | 64.22 | - | 30.60 | - | - | - | - | - | - |
2024-07-19 11:04 am | 3.3 | 63.68 | - | 30.60 | - | - | - | - | - | - |
2024-07-19 10:04 am | 3.3 | 63.50 | - | 30.60 | - | - | - | - | - | - |
2024-07-19 09:04 am | 3.3 | 62.78 | - | 30.70 | - | - | - | - | - | - |
2024-07-19 08:04 am | 3.3 | 62.42 | - | 30.70 | - | - | - | - | - | - |
2024-07-19 07:04 am | 3.3 | 62.24 | - | 30.60 | - | - | - | - | - | - |
2024-07-19 06:04 am | 3.3 | 62.42 | - | 30.60 | - | - | - | - | - | - |
2024-07-19 05:04 am | 3.3 | 62.60 | - | 30.60 | - | - | - | - | - | - |
2024-07-19 04:04 am | 3.3 | 62.42 | - | 30.50 | - | - | - | - | - | - |
2024-07-19 03:04 am | 3.3 | 61.88 | - | 30.50 | - | - | - | - | - | - |
2024-07-19 02:04 am | 3.3 | 60.98 | - | 30.60 | - | - | - | - | - | - |
2024-07-19 01:04 am | 3.3 | 61.52 | - | 30.60 | - | - | - | - | - | - |
2024-07-19 12:04 am | 3.3 | 62.06 | - | 30.60 | - | - | - | - | - | - |
2024-07-18 11:04 pm | 3.3 | 62.06 | - | 30.60 | - | - | - | - | - | - |
2024-07-18 10:04 pm | 3.3 | 62.60 | - | 30.50 | - | - | - | - | - | - |
2024-07-18 09:04 pm | 3.3 | 63.14 | - | 30.60 | - | - | - | - | - | - |
2024-07-18 08:04 pm | 3.3 | 62.96 | - | 30.60 | - | - | - | - | - | - |
2024-07-18 07:04 pm | 3.3 | 63.50 | - | 30.60 | - | - | - | - | - | - |
2024-07-18 06:04 pm | 3.3 | 62.78 | - | 30.70 | - | - | - | - | - | - |