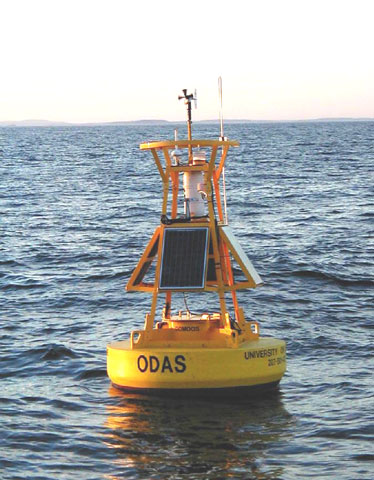
Station 44037 - Buoy M01 - Jordan Basin ![Image indicating link to RSS feed of recent meteorological observations for station 44037](/images/feed-icon-14x14.png)
Previous observations
TIME (EDT) |
![5-day plot - Wind Direction 5-day plot - Wind Direction](/images/graph04.gif) WDIR |
![5-day plot - Wind Speed 5-day plot - Wind Speed](/images/graph04.gif) WSPD kts |
![5-day plot - Wind Gust 5-day plot - Wind Gust](/images/graph04.gif) GST kts |
![5-day plot - Wave Height 5-day plot - Wave Height](/images/graph04.gif) WVHT ft |
![5-day plot - Dominant Wave Period 5-day plot - Dominant Wave Period](/images/graph04.gif) DPD sec |
![5-day plot - Average Wave Period 5-day plot - Average Wave Period](/images/graph04.gif) APD sec |
![5-day plot - Mean Wave Direction 5-day plot - Mean Wave Direction](/images/graph04.gif) MWD |
![5-day plot - Atmospheric Pressure 5-day plot - Atmospheric Pressure](/images/graph04.gif) PRES in |
![5-day plot - Pressure Tendency 5-day plot - Pressure Tendency](/images/graph04.gif) PTDY in |
![5-day plot - Air Temperature 5-day plot - Air Temperature](/images/graph04.gif) ATMP °F |
![5-day plot - Water Temperature 5-day plot - Water Temperature](/images/graph04.gif) WTMP °F |
![5-day plot - Dew Point 5-day plot - Dew Point](/images/graph04.gif) DEWP °F |
![5-day plot - Salinity 5-day plot - Salinity](/images/graph04.gif) SAL psu |
![5-day plot - Visibility 5-day plot - Visibility](/images/graph04.gif) VIS nmi |
![5-day plot - Tide (above MLLW) 5-day plot - Tide (above MLLW)](/images/graph04.gif) TIDE ft |
2024-07-15 08:04 pm | SSW | 11.7 | 13.6 | 3.3 | 8 | - | - | 29.79 | - | 65.3 | 61.2 | - | 31.80 | 1.6 | - |
2024-07-15 07:04 pm | SSW | 9.7 | 11.7 | 3.3 | 8 | - | - | 29.78 | - | 65.1 | 61.2 | - | 31.80 | 1.6 | - |
2024-07-15 06:04 pm | SSW | 11.7 | 13.6 | 3.3 | 8 | - | - | 29.79 | - | 65.8 | 61.3 | - | 31.80 | 1.6 | - |
2024-07-15 05:04 pm | S | 9.7 | 11.7 | 3.3 | 8 | - | - | 29.79 | - | 65.5 | 61.7 | - | 31.80 | 1.6 | - |
2024-07-15 04:04 pm | S | 11.7 | 11.7 | 3.3 | 6 | - | - | 29.80 | - | 65.7 | 61.7 | - | 31.80 | 1.6 | - |
2024-07-15 03:04 pm | S | 11.7 | 11.7 | 3.0 | 8 | - | - | 29.83 | - | 64.9 | 61.7 | - | 31.80 | 1.6 | - |
2024-07-15 02:04 pm | S | 9.7 | 9.7 | 3.0 | 8 | - | - | 29.85 | - | 64.4 | 61.7 | - | 31.80 | 1.6 | - |
2024-07-15 01:04 pm | S | 9.7 | 11.7 | 3.0 | 8 | - | - | 29.86 | - | 64.8 | 62.1 | - | 31.80 | 1.6 | - |
2024-07-15 12:04 pm | SSW | 9.7 | 9.7 | 3.0 | 8 | - | - | 29.87 | - | 64.8 | 61.5 | - | 31.80 | 1.6 | - |
2024-07-15 11:04 am | SSW | 9.7 | 9.7 | 3.0 | 8 | - | - | 29.86 | - | 64.9 | 61.3 | - | 31.80 | 1.6 | - |
2024-07-15 10:04 am | SSW | 9.7 | 11.7 | 2.6 | 8 | - | - | 29.88 | - | 64.8 | 61.2 | - | 31.80 | 1.6 | - |
2024-07-15 09:04 am | SSW | 9.7 | 9.7 | 2.6 | 8 | - | - | 29.88 | - | 64.2 | 61.0 | - | 31.80 | 1.6 | - |
2024-07-15 08:04 am | SSW | 7.8 | 9.7 | 2.6 | 8 | - | - | 29.88 | - | 64.4 | 61.2 | - | 31.80 | 1.6 | - |
2024-07-15 07:04 am | S | 7.8 | 9.7 | 2.6 | 8 | - | - | 29.87 | - | 64.2 | 61.2 | - | 31.80 | 1.6 | - |
2024-07-15 06:04 am | S | 7.8 | 9.7 | 3.0 | 8 | - | - | 29.87 | - | 64.0 | 61.3 | - | 31.70 | 1.6 | - |
2024-07-15 05:04 am | SSW | 7.8 | 9.7 | 3.0 | 6 | - | - | 29.87 | - | 63.3 | 61.2 | - | 31.80 | 1.6 | - |
2024-07-15 04:04 am | SSW | 7.8 | 9.7 | 3.3 | 6 | - | - | 29.86 | - | 63.3 | 61.2 | - | 31.70 | 1.6 | - |
2024-07-15 03:04 am | SSW | 7.8 | 7.8 | 3.3 | 6 | - | - | 29.87 | - | 63.0 | 61.0 | - | 31.80 | 1.6 | - |
2024-07-15 02:04 am | SW | 7.8 | 7.8 | 3.0 | 6 | - | - | 29.88 | - | 63.9 | 61.2 | - | 31.80 | 1.6 | - |
2024-07-15 01:04 am | SW | 7.8 | 9.7 | 3.0 | 8 | - | - | 29.90 | - | 63.9 | 61.3 | - | 31.80 | 1.6 | - |
2024-07-15 12:04 am | SW | 9.7 | 11.7 | 3.0 | 8 | - | - | 29.91 | - | 63.9 | 61.3 | - | 31.80 | 1.6 | - |
2024-07-14 11:04 pm | SW | 9.7 | 11.7 | 2.6 | 8 | - | - | 29.91 | - | 64.2 | 61.3 | - | 31.80 | 1.6 | - |
2024-07-14 10:04 pm | SW | 7.8 | 9.7 | 2.3 | 8 | - | - | 29.91 | - | 63.3 | 61.2 | - | 31.80 | 1.6 | - |
These oceanographic data are displayed in rounded times.
Click on the graph icon in the table below to see a time series plot of the last five days of that observation. |
Depth (DEPTH): | 3.3 ft |
Ocean Temperature (OTMP): | 60.98 °F |
Salinity (SAL): | 31.80 psu |
Previous observations
TIME (EDT) |
DEPTH ft |
![5-day plot - Ocean Temperature 5-day plot - Ocean Temperature](/images/graph04.gif) OTMP °F |
![5-day plot - Conductivity 5-day plot - Conductivity](/images/graph04.gif) COND mS/cm |
![5-day plot - Salinity 5-day plot - Salinity](/images/graph04.gif) SAL psu |
![5-day plot - Oxygen Concentration 5-day plot - Oxygen Concentration](/images/graph04.gif) O2% % |
![5-day plot - Oxygen Concentration 5-day plot - Oxygen Concentration](/images/graph04.gif) O2PPM ppm |
![5-day plot - Chlorophyll 5-day plot - Chlorophyll](/images/graph04.gif) CLCON ug/l |
![5-day plot - Turbidity 5-day plot - Turbidity](/images/graph04.gif) TURB FTU |
![5-day plot - pH 5-day plot - pH](/images/graph04.gif) PH |
![5-day plot - Eh 5-day plot - Eh](/images/graph04.gif) EH mv |
2024-07-15 08:04 pm | 3.3 | 61.16 | - | 31.80 | - | - | - | - | - | - |
2024-07-15 07:04 pm | 3.3 | 61.16 | - | 31.80 | - | - | - | - | - | - |
2024-07-15 06:04 pm | 3.3 | 61.34 | - | 31.80 | - | - | - | - | - | - |
2024-07-15 05:04 pm | 3.3 | 61.70 | - | 31.80 | - | - | - | - | - | - |
2024-07-15 04:04 pm | 3.3 | 61.70 | - | 31.80 | - | - | - | - | - | - |
2024-07-15 03:04 pm | 3.3 | 61.70 | - | 31.80 | - | - | - | - | - | - |
2024-07-15 02:04 pm | 3.3 | 61.70 | - | 31.80 | - | - | - | - | - | - |
2024-07-15 01:04 pm | 3.3 | 62.06 | - | 31.80 | - | - | - | - | - | - |
2024-07-15 12:04 pm | 3.3 | 61.52 | - | 31.80 | - | - | - | - | - | - |
2024-07-15 11:04 am | 3.3 | 61.34 | - | 31.80 | - | - | - | - | - | - |
2024-07-15 10:04 am | 3.3 | 61.16 | - | 31.80 | - | - | - | - | - | - |
2024-07-15 09:04 am | 3.3 | 60.98 | - | 31.80 | - | - | - | - | - | - |
2024-07-15 08:04 am | 3.3 | 61.16 | - | 31.80 | - | - | - | - | - | - |
2024-07-15 07:04 am | 3.3 | 61.16 | - | 31.80 | - | - | - | - | - | - |
2024-07-15 06:04 am | 3.3 | 61.34 | - | 31.70 | - | - | - | - | - | - |
2024-07-15 05:04 am | 3.3 | 61.16 | - | 31.80 | - | - | - | - | - | - |
2024-07-15 04:04 am | 3.3 | 61.16 | - | 31.70 | - | - | - | - | - | - |
2024-07-15 03:04 am | 3.3 | 60.98 | - | 31.80 | - | - | - | - | - | - |
2024-07-15 02:04 am | 3.3 | 61.16 | - | 31.80 | - | - | - | - | - | - |
2024-07-15 01:04 am | 3.3 | 61.34 | - | 31.80 | - | - | - | - | - | - |
2024-07-15 12:04 am | 3.3 | 61.34 | - | 31.80 | - | - | - | - | - | - |
2024-07-14 11:04 pm | 3.3 | 61.34 | - | 31.80 | - | - | - | - | - | - |
2024-07-14 10:04 pm | 3.3 | 61.16 | - | 31.80 | - | - | - | - | - | - |